About this app
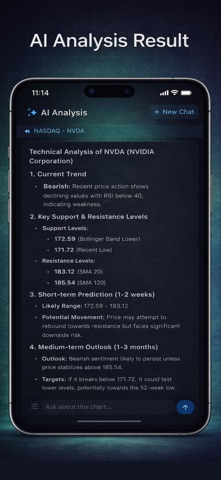
Make smarter investment decisions with AI that reads your charts. ChartMind combines real-time candlestick charts with AI-powered technical analysis to help you understand market trends at a glance. Select any stock from NASDAQ or NYSE, view professional-grade charts, and let AI break down what the indicators are telling you. KEY FEATURES AI-Powered Chart Analysis - Get instant AI analysis of any stock chart with one tap - Choose from 3 built-in analysis templates: Trend and Prediction: support/resistance levels, price forecasts, buy/sell/hold signals Technical Summary: indicator interpretations, divergence detection, pattern analysis Quick Outlook: decisive direction call with target price and confidence level - Build fully custom analysis prompts with control over data period and indicator inclusion - Ask follow-up questions in a persistent chat to dig deeper into any analysis Real-Time Charts and Data - Live candlestick charts with 1-day, 1-week, and 1-month intervals - Real-time price updates streamed via WebSocket - Interactive pinch-to-zoom and pan navigation - Volume bars with moving average comparison Professional Technical Indicators - Simple Moving Average (SMA) with 4 configurable periods - RSI with overbought and oversold zone alerts - MACD with histogram and signal line crossover detection - Bollinger Bands with customizable period and deviation - Volume analysis with 5-day and 20-day averages - All indicator parameters fully adjustable Broad US Market Coverage - 1700+ stocks across NASDAQ and NYSE - Organized by exchange with quick search - Symbol logos for easy identification Conversation History - All AI analyses saved automatically - Browse past conversations organized by stock symbol - Continue any previous analysis with full context preserved HOW TO USE CHARTMIND 1. Pick a stock from NASDAQ or NYSE 2. Choose your chart interval and configure indicators 3. Tap the AI button and select an analysis template 4. Read the AI breakdown of trends, signals, and price targets 5. Ask follow-up questions to explore deeper Whether you are researching your next trade, learning technical analysis, or looking for a second opinion on a chart pattern, ChartMind gives you AI-driven insights in seconds. Download ChartMind and start analyzing smarter today.
Latest release
What’s New
Bug Fix
Audience growth
Ratings growth
Baseline captured. Growth appears after the crawler observes a changed rating count.
Momentum comes from crawler snapshots for the tracked storefront. “Viral growth signal” means unusually fast recent rating gains; it is an indicator, not download data.
Price tracking
Price intelligence
First snapshot captured. The trend line starts after the next crawler price observation.
- First observed Aug 11, 2026 · 7:32 PM Free
Screenshots