About this app
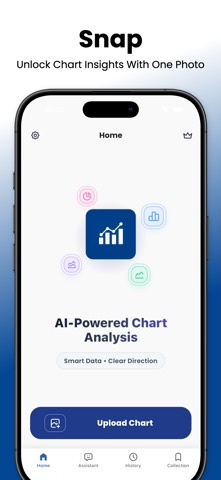
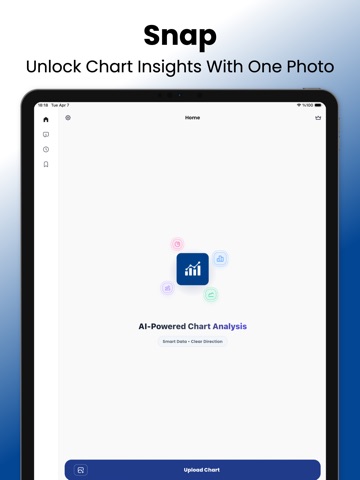
Analyze any chart in seconds with ChartSnap — your AI-powered chart analysis companion. Whether you're a beginner just learning to read charts or an experienced trader seeking a faster workflow, ChartSnap transforms complex technical charts into clear, actionable insights — automatically. What ChartSnap does for you: Simply upload or photograph any financial chart and our AI engine gets to work immediately. ChartSnap identifies support and resistance levels, detects chart patterns such as head and shoulders, double tops, triangles, and flags, and reads key indicators including RSI, MACD, and Bollinger Bands — delivering a complete analysis within seconds. Key Features: • AI Chart Recognition — Automatic trend, pattern, and indicator detection • Support & Resistance Levels — Instantly see critical price zones • Technical Indicator Reading — RSI, MACD, Bollinger Bands and more • Beginner-Friendly — Plain language explanations for every analysis • Analysis History — Save, organize, and revisit all your past analyses • Fast & Accurate — Results in seconds, not hours Ideal for: • Stock market traders and investors • Crypto chart analysis • Forex technical analysis • Anyone learning technical analysis • Day traders who need fast insights Why ChartSnap? Technical analysis is a skill that takes years to master — but ChartSnap bridges the gap. Our AI has studied thousands of chart formations to deliver reliable, instant analysis that helps you make more informed decisions. Stop spending hours on manual analysis. Let AI do the heavy lifting. Subscription: Full AI chart analysis and history access require a subscription. Choose monthly or annual plans for the best value. Privacy Policy: http://project13266451.tilda.ws/chartsnap/privacy Terms of Service: http://project13266451.tilda.ws/chartsnap/terms
Latest release
What’s New
• The latest version includes bug fixes and performance improvements.
Audience growth
Ratings growth
Baseline captured. Growth appears after the crawler observes a changed rating count.
Momentum comes from crawler snapshots for the tracked storefront. “Viral growth signal” means unusually fast recent rating gains; it is an indicator, not download data.
Price tracking
Price intelligence
First snapshot captured. The trend line starts after the next crawler price observation.
- First observed Aug 26, 2026 · 8:27 PM Free
Screenshots