About this app
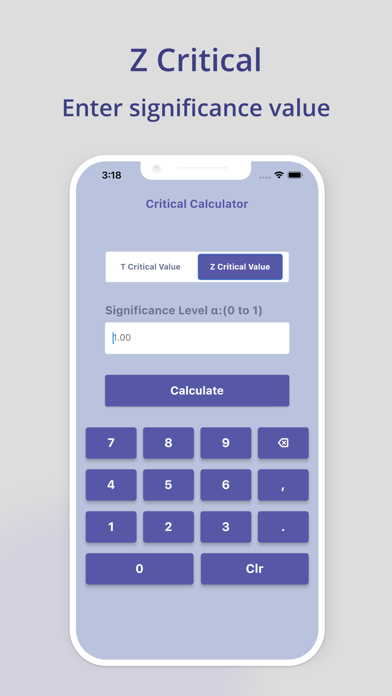
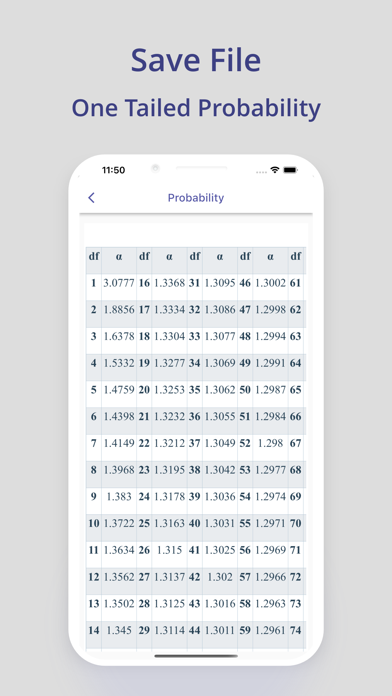
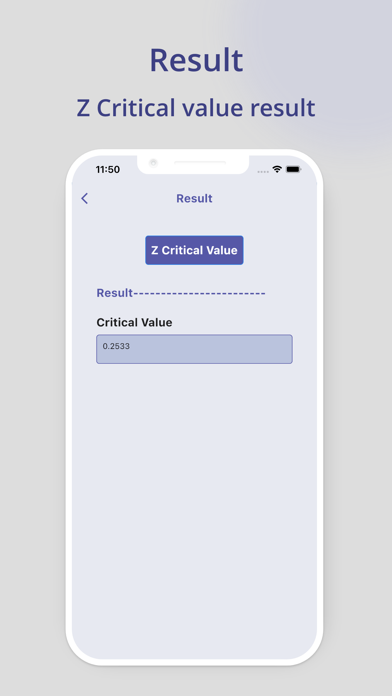
Perform hypothesis testing through our efficient critical value calculator. Critical value calculator, a hands-on tool for statisticians, calculates t-value and z-value with a click. Single t-value calculator and z-value calculator are available for use yet, they do not suffice the needs of students. However, in this critical score calculator you can calculate both critical values. Now you can get rid of tiresome practice of looking through hundreds of t- and z-value tables because critical value calculator calculates them in an instant. How to perform calculations: Calculate t-value 1. Specify the significance level in the given box. 2. Select degrees of freedom. 3. Calculate t-value Calculate z-value 1. Enter the significance level in the input box. 2. calculate p-value You can reset the critical value calculator by pressing “reset” button. Basic definitions: 1. Critical value: It is the cut-off value of the graph generated by the test static and shows the region where test static does not lie. Critical value depends upon the significance level. T tells whether to accept of discard null-hypothesis. 2. Significance level: Significance level or statistical significance determines that the difference in population cannot be only associated with chance. 3. Null hypothesis: A hypothesis that describes no difference between two data. And if any difference is seen it appears only by chance. It is abbreviated as (Ho). 4. T-value: It is the calculated difference in the graph relative to the data. 5. Z-value: It is a cut-off point area under the standard distribution of data.
Latest release
What’s New
fix issues improve stability bug fixes
Audience growth
Ratings growth
Baseline captured. Growth appears after the crawler observes a changed rating count.
Momentum comes from crawler snapshots for the tracked storefront. “Viral growth signal” means unusually fast recent rating gains; it is an indicator, not download data.
Price tracking
Price intelligence
First snapshot captured. The trend line starts after the next crawler price observation.
- First observed Aug 8, 2026 · 11:46 AM Free
Screenshots