About this app
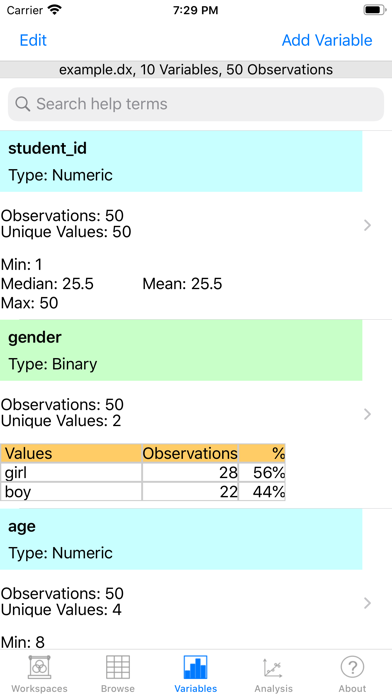
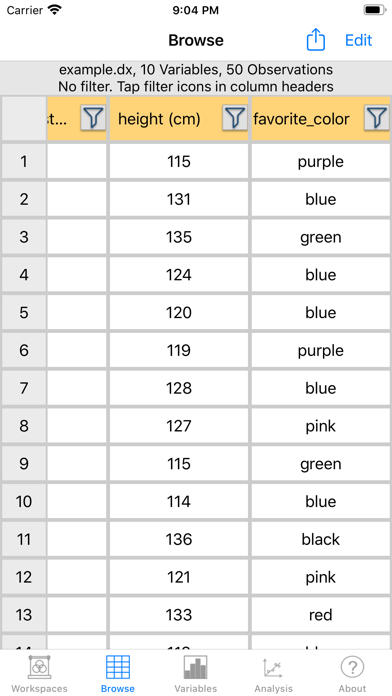
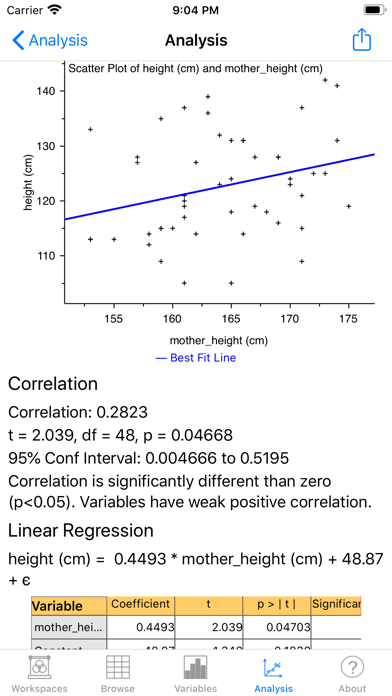
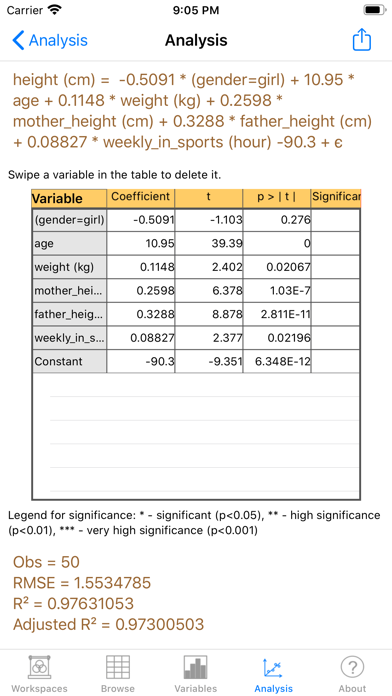
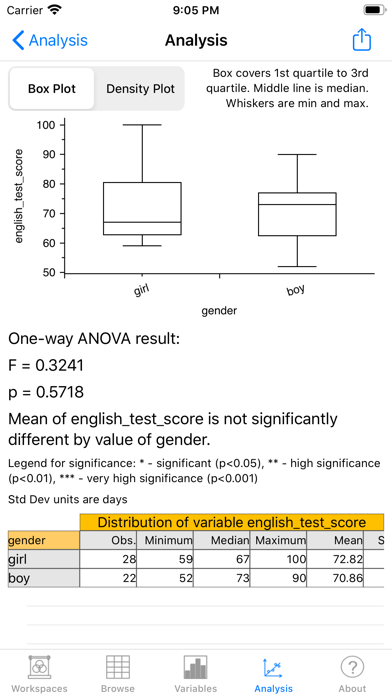
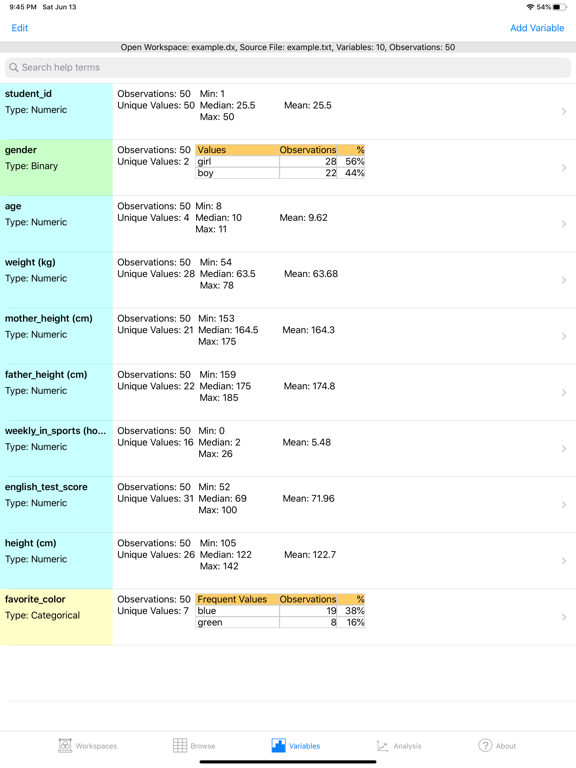
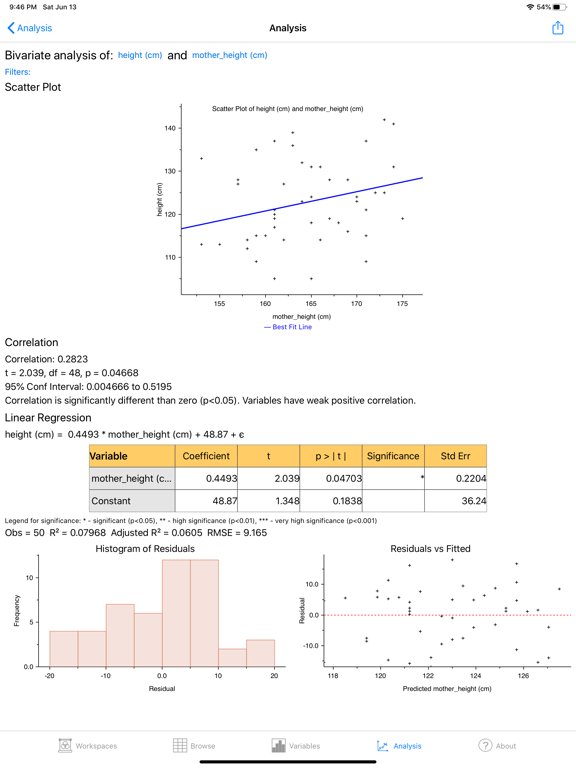
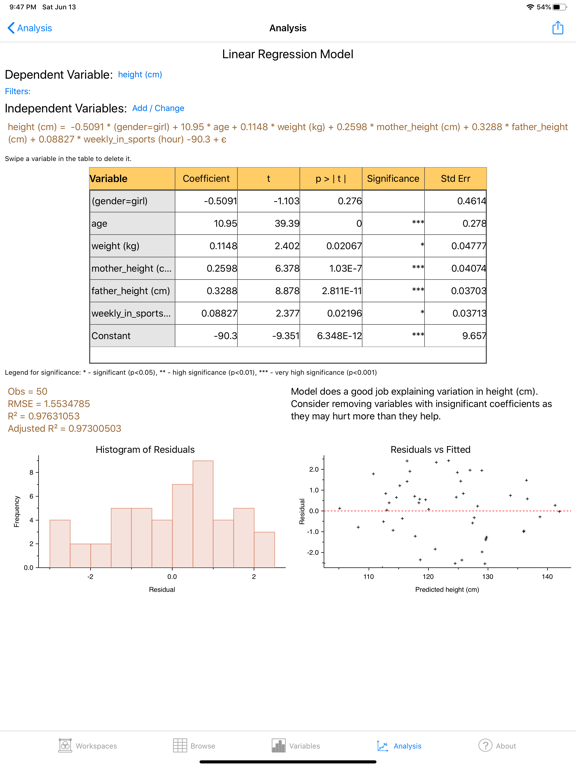
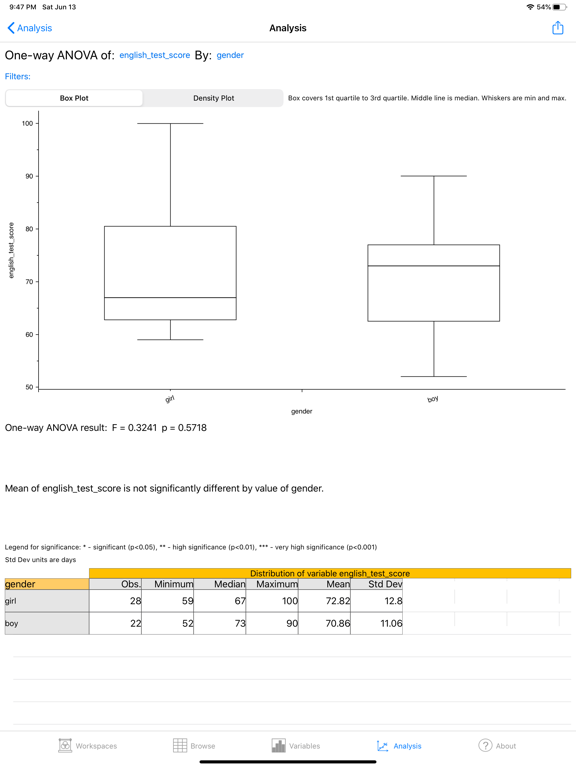
Explore and analyze your datasets. Find patterns within and between variables. Use industry standard statistical techniques without being a stats expert. Get plain english explanations. Data Explorer makes the world of data analysis accessible to the rest of us. Features include:: • Import data files (csv, txt, xls, xlsx) • Enter / edit data by hand • Browse your data set. Apply filters to zero in on the rows that interest you. • Get key stats on each variable and see a graph of its distribution • Variables can be numerical, categorical, or date / time. • Hypothesis tests of means and proportions. One, two, and paired samples. • Two way frequency tables of what values categorical variables take, including phi and Cramer's V statistics • See the distribution of a numerical variables broken down by levels of a categorical variable, including one-way ANOVA, box plot, and density plot • See how two numerical variables vary with each other (correlation) • Explain how one numerical variable varies by a combination of other numerical variables (linear and logistic regression) • Variable transformations. Calculate squares, logs, and other commonly used transformation for use in your regressions and correlations All analysis include: • Results are given in statistical terms and also in plain english • Put as many filters as you want on each analysis to focus in on the part of your data you're interested in Accepts data input in the following formats: • enter data by hand while in the field • import comma separated files (.csv) • import tab delimited text files (.txt) • import excel files (xls and xlsx) • Current version limited to 100,000 rows and 500 columns to be conservative about performance. Export options: • Email PDFs and CSVs of variable summaries and analysis results • Print variable summaries and analysis results • Email CSV of datasets you've entered or edited We are actively developing this app and have additional features lined up. Your feedback can influence the priority we put on different features so please let us know what matters to you!
Latest release
What’s New
Fixed issue where filters on the data were not reflected in output in some situations
Audience growth
Ratings growth
Baseline captured. Growth appears after the crawler observes a changed rating count.
Momentum comes from crawler snapshots for the tracked storefront. “Viral growth signal” means unusually fast recent rating gains; it is an indicator, not download data.
Price tracking
Price intelligence
First snapshot captured. The trend line starts after the next crawler price observation.
- First observed Aug 24, 2026 · 1:39 AM $9.99
Screenshots