About this app
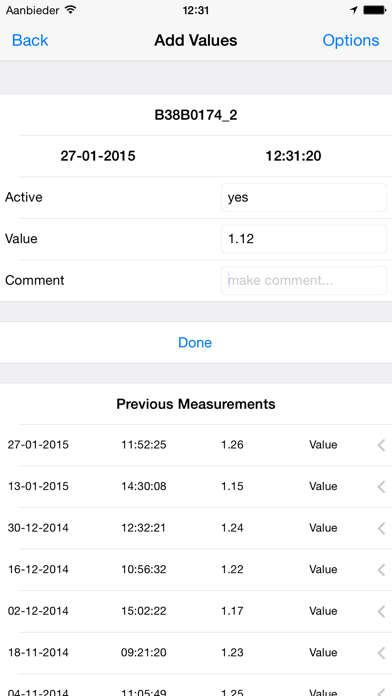
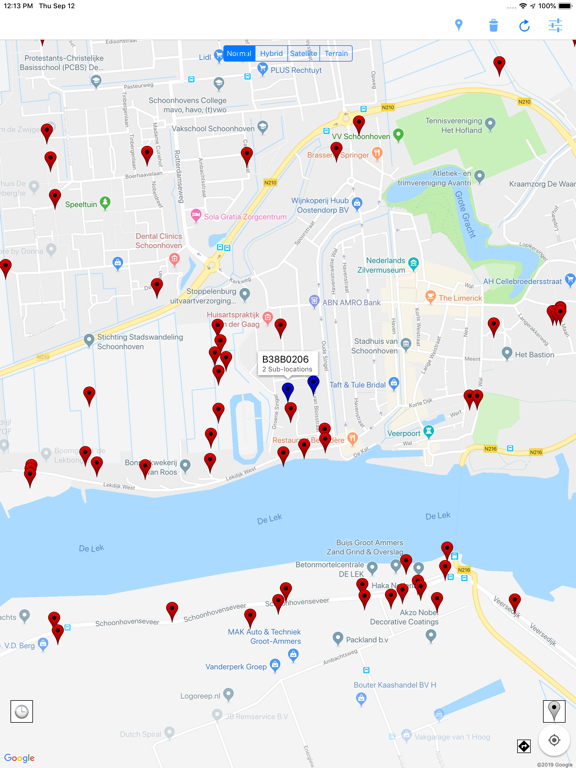
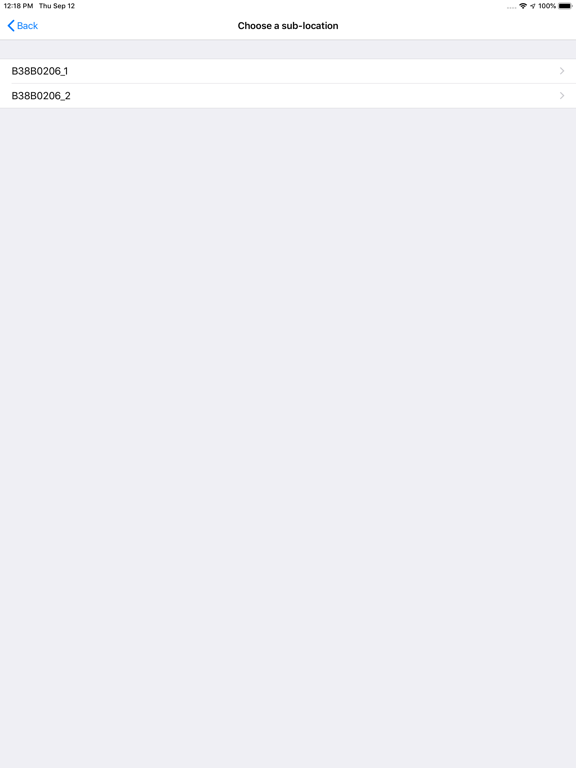
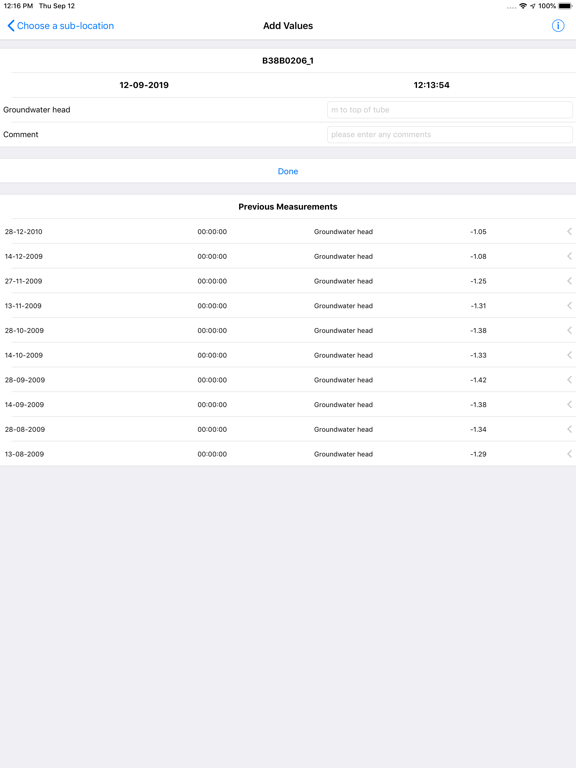
Use FieldLogger to conduct location-bound measurements in the field, store the values on your phone in csv-format, and share the measurements by mail or FTP. You can add locations by hand, or import them from a csv-file. You can choose which type of measurements can be performed at each location, before you add new measurements. At the end of the day, you can mail the locally stored locations and measurements to yourself or anybody else. The locations and measurements can also be imported into the app. FieldLogger was initially build to log measurements of groundwater head in wells, but it has grown into a tool to store measurements that are bound to a location, but vary with time. No internet connection is needed to perform the measurements (the google maps background needs an internet connection though). The app is completely free, with no ads. If you find any bugs, please contact us. If you use the app and like it, please rate it. The data is stored in two csv-files: the locations in the file locations.csv and the measurements in the file measurments.csv. The locations.csv has the following propierties: The columns are separated by ';', and the title-row has to include the following fields: NAME, SUBNAME, LAT, LON. If the user wants to use his own input-fields at each location, the field INPUTFIELD needs to be added to the header as well. For each location the input-fields are separated by '|'. At the top of the file these input-fields have to be defined by three column rows, preceeded by the header NAME;INPUTTYPE;HINT. For each location the input-fields are selected by matching the INPUTFIELD in the location list to the NAME string in the input-field list. So the locations.csv-file will look something like this: NAME;INPUTTYPE;HINT Value;number;in m. to top of tube Comment;text;make comment... NAME;SUBNAME;LAT;LON;INPUTFIELD Well1;Well1_1;53.2983;6.6653;Value|Comment Well1;Well1_2;53.2983;6.6653;Value|Comment Well2;Well2_1;53.2988;6.7286;Value|Comment The measurements.csv has the following propierties: A five-column (also seperated by ';') csv-file with the header LOCATION;DATE;TIME;VALUE;TYPE So the meassurements.csv-file will look something like this: LOCATION;DATE;TIME;VALUE;TYPE Well1_1;26-08-2014;07:56:14;5.53;Value Well1_1;26-08-2014;07:56:14;Waterlevel is high;Comment Well1_2;26-08-2014;07:57:11;The well is dry;Comment The development of this iOS app, including the additional features, was made possible by the Dutch Waterboard Peel & Maasvallei.
Latest release
What’s New
Added support for pdf's in location information (property must be named 'PHOTO')
Audience growth
Ratings growth
Baseline captured. Growth appears after the crawler observes a changed rating count.
Momentum comes from crawler snapshots for the tracked storefront. “Viral growth signal” means unusually fast recent rating gains; it is an indicator, not download data.
Price tracking
Price intelligence
First snapshot captured. The trend line starts after the next crawler price observation.
- First observed Aug 19, 2026 · 11:29 AM Free
Screenshots