About this app
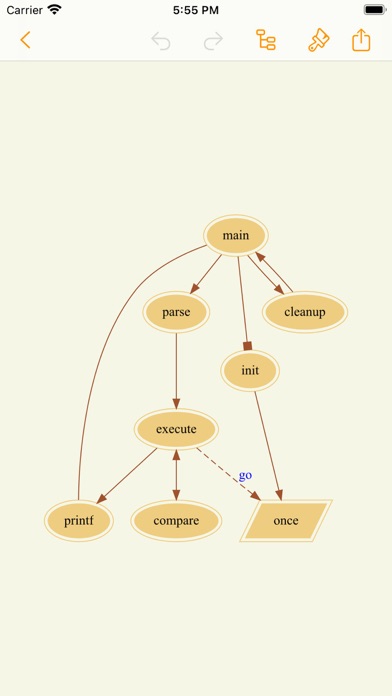
A graph (a mathematical concept) is used to describe the intricate relationships between various things in reality. Nodes represent an object, and edges represent connections between objects. Graph Editor provides a visual way to create and edit Graph based on the open source software Graphviz. Graphviz is a visual graphics tool open sourced by AT&T Research and Lucent Bell Labs, which can be easily used to draw structured graph networks and supports output in multiple formats. Graph Editor supports creating directed and undirected graphs, using dot layout. Usually Graphviz uses scripts as input, and Graph Editor can create complex and beautiful graph structures just by clicking on the screen, which is completely automaticly. You can set the color, width, and line style of nodes and edges, and you can also group some nodes into a subgraph. Graph Editor performs various operations on Graph directly in memory, and users do not have to worry about the calculation time of complex graphs. Graph Editor supports exporting the created Graph to PNG, JPG, PDF, and SVG files, and will support more export types in the future. #More graph concepts In mathematics, a graph is a structure described by a set of objects, some pairs of which are "related" in some sense. These objects correspond to mathematical abstractions called vertices (also called nodes or points), and each related pair of vertices is called an edge (also called a link or line). Typically, graphs are graphically depicted as a set of points or rings of vertices, connected by lines or curves of edges. Graph is one of the research objects of discrete mathematics. Privacy Policy: https://askrsw.github.io/#/grapheditorpolicyen Terms of Use: https://askrsw.github.io/#/grapheditoruserusageen
Latest release
What’s New
Supports exporting Graphviz dot files.
Audience growth
Ratings growth
Baseline captured. Growth appears after the crawler observes a changed rating count.
Momentum comes from crawler snapshots for the tracked storefront. “Viral growth signal” means unusually fast recent rating gains; it is an indicator, not download data.
Price tracking
Price intelligence
First snapshot captured. The trend line starts after the next crawler price observation.
- First observed Aug 21, 2026 · 11:23 AM Free
Screenshots