About this app
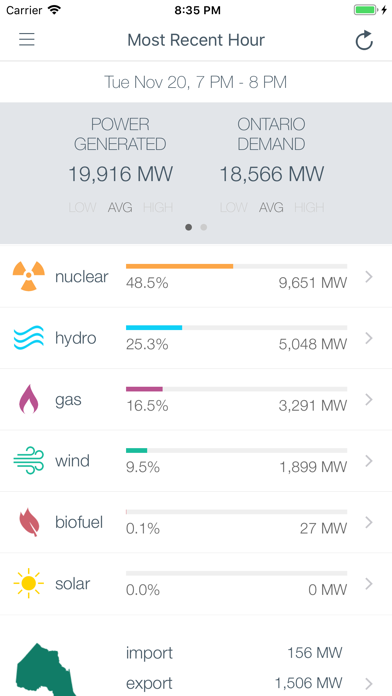
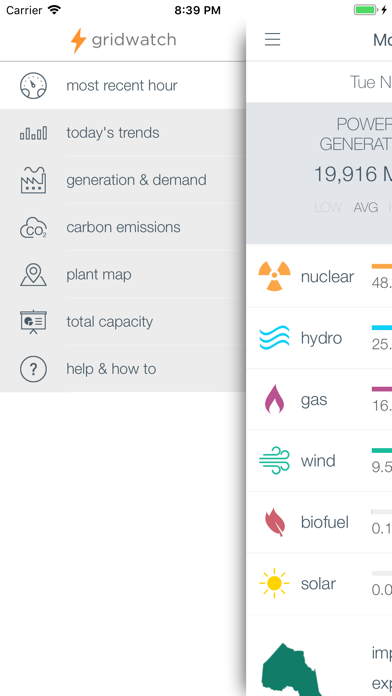
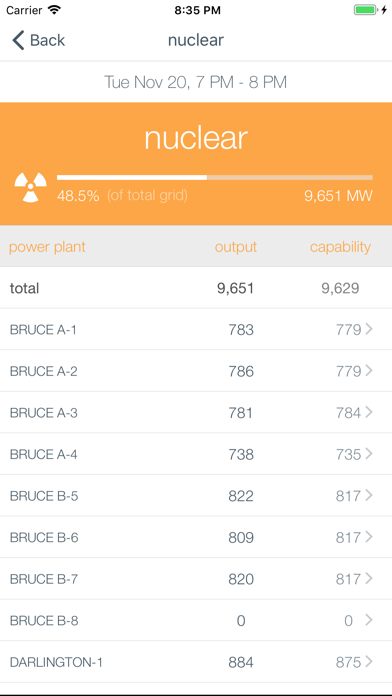
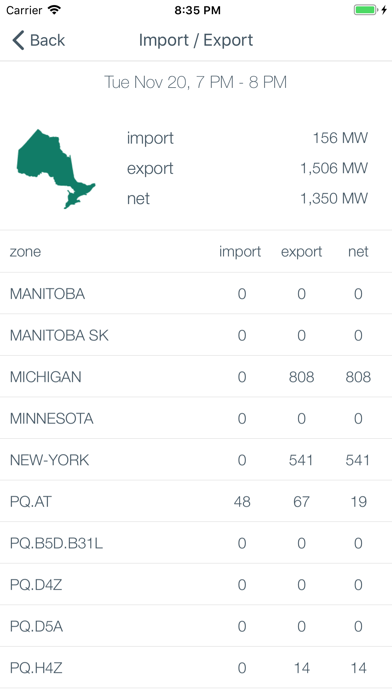
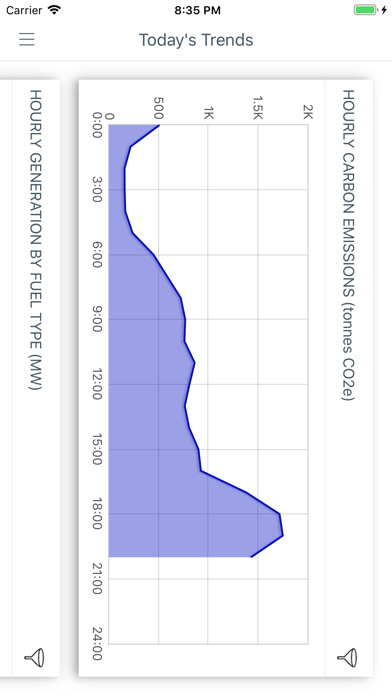
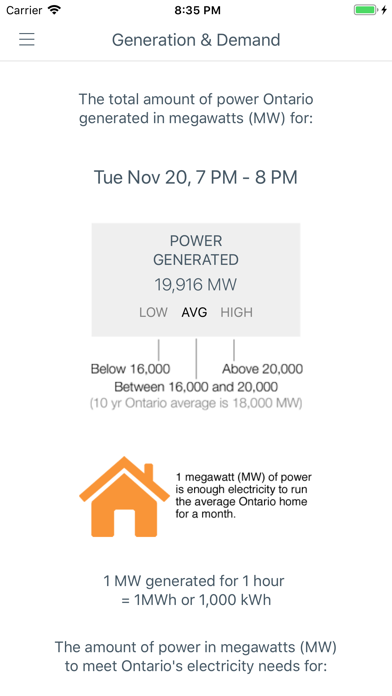
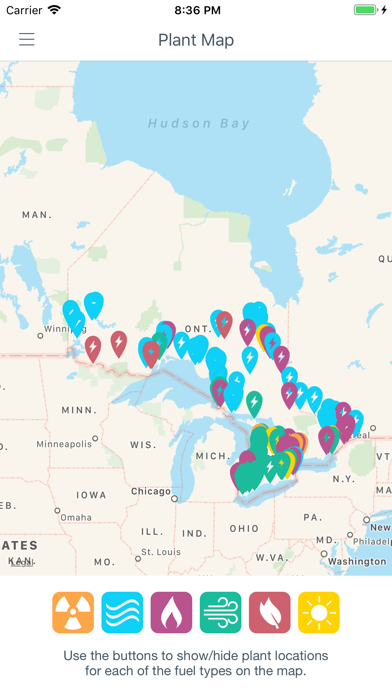
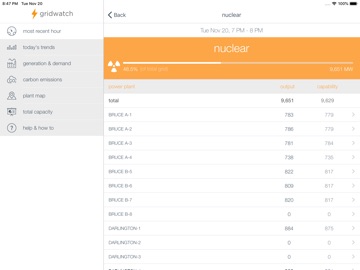
See where Ontario's power comes from, when the grid is clean and when it's not. GRIDWATCH HELPS MAKE ONTARIO'S ELECTRICITY GRID VISIBLE. //Hourly Power & Demand Track Ontario’s electricity grid hour-by-hour and plant-by-plant using the most current, trustworthy data. Gridwatch breaks out the total generation by fuel type with an option to drill down further for hourly capability and output figures for each power plant. Gridwatch also tracks hourly imports, exports and Ontario's Provincial demand. //Total Emissions & Intensity See the total carbon emissions and carbon intensity of Ontario's electricity grid. Drill down into the equivalent emissions in terms of cars and trees to put things in context. Backed by a peer reviewed and published methodology, carbon intensity is a simple indication of how clean (or dirty) the grid is. //Power Plant Details Gridwatch not only breaks down total generation by fuel type but also by individual power plant. Each plant's capability and actual contribution a listed for every hour. Want to know more about a specific plant? Location, owner/operator and a specific knowledge nugget is provided for each facility. //Maps & Trends View all power plant locations colour coded by fuel type on an interactive map of Ontario. Filter by fuel type, zoom in/out and tap for details about the specific plant. Track both power and emissions trends for the current day along with Ontario's Time-Of-Use schedule. Interact with the trend graphs to see the impact each fuel type has on the grid. A note to our users outside of Ontario: Gridwatch only tracks the Province of Ontario's electricity grid and does so in Eastern Time.
Latest release
What’s New
- Updated for newer phones and tablets - Refreshed icons and colours - Maintenance and bug fixes Please email us at support@gridwatch.ca with any issues, feedback or suggestions.
Audience growth
Ratings growth
Baseline captured. Growth appears after the crawler observes a changed rating count.
Momentum comes from crawler snapshots for the tracked storefront. “Viral growth signal” means unusually fast recent rating gains; it is an indicator, not download data.
Price tracking
Price intelligence
First snapshot captured. The trend line starts after the next crawler price observation.
- First observed Sep 3, 2026 · 10:12 PM Free
Screenshots