About this app
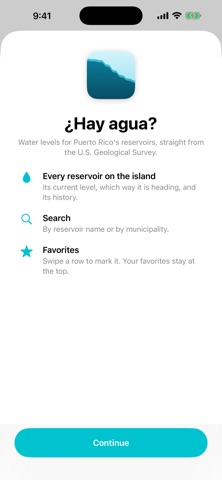
¿Hay agua? shows you at a glance how Puerto Rico's reservoirs are doing, with data straight from the U.S. Geological Survey (USGS). All in one list The island's 23 reservoirs on a single screen, each with its current level and which way it's heading. Mark the ones you care about as favorites and they stay at the top. The full history Tap any reservoir to see its level over the last 7, 30, or 90 days in a clear chart, along with how much it has risen or fallen in the last hour, day, week, and quarter. Alert level Each reservoir shows which band it falls into —Overflow, Safety, Observation, Adjustments, Control, or Out of service— with the same colors and thresholds published by Puerto Rico's Aqueducts and Sewers Authority (AAA). Search By reservoir name or by your municipality. Where the data comes from From USGS gauges, which take readings every 15 minutes. The data is provisional and subject to revision. The app shows where the USGS reading falls; AAA's official bulletin may report a different band, since it measures with its own instruments. English and Spanish. With dark mode and Dynamic Type.
Latest release
What’s New
Made-to-measure settings, and real iPad support. • The app is now universal: on iPad you see the list and the details side by side, in portrait and landscape. • New Settings screen: – Pick your unit: feet or meters. – Pick your reference: above sea level (as the USGS reports it) or depth of the water at the dam. – Pick the app's language, independent from the device's.
Audience growth
Ratings growth
Baseline captured. Growth appears after the crawler observes a changed rating count.
Momentum comes from crawler snapshots for the tracked storefront. “Viral growth signal” means unusually fast recent rating gains; it is an indicator, not download data.
Price tracking
Price intelligence
First snapshot captured. The trend line starts after the next crawler price observation.
- First observed Sep 1, 2026 · 3:24 PM $0.99
Screenshots