About this app
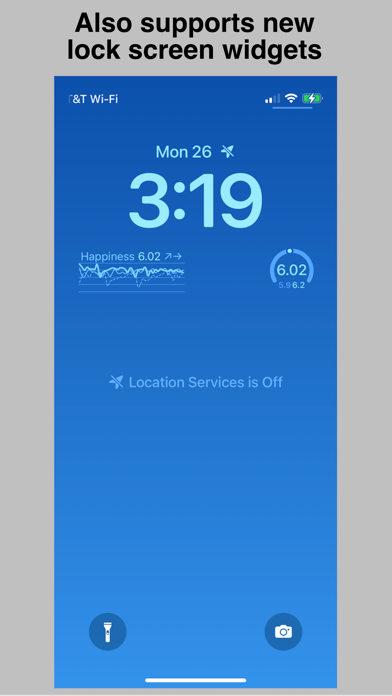
Hedonometer is a new app that displays Hedonometer.org's social media-based sentiment analysis - an innovative measure of social happiness. The graph displays up to three years of data. Previous years are overlayed year-to-date so you can compare a given data or date ranges to previous years. The language used for the sentiment analysis can be set with the language setting. You can also select various graph styles to help see the data that suites your preference. And you can toggle seeing the previous year or the year before that to be able to compare historical timelines, or just focus in this year’s data. You can explore data by tapping on the graph to display a cursor that you can move around by holding your finger down and sliding the cursor left or right. The app will show you the data at the cursor position. You can zoom the graph with the graph scale slider control. The scale ranges from 6 weeks to a full year. When you are zoomed in, you can swipe left or right on the graph to scroll to other areas of the graph. The Watch app displays the same interactive graph with similar controls. The Watch uses the crown wheel to zoom in and out of the graph when the cursor is not active, and moves the cursor when the cursor is enabled. The dark green area under the graph in the iPhone will show annotations for important events when you are exploring the happiness timeline data. The app supports Watch complications and iPhone widgets including the new iOS 16 Lock Screen widgets. Data for complications and widgets is automatically updated in the background, so there is no need to open or manually refresh the app to see the latest data. Hedonometer.org's data is updated once a day. The complications and widgets always show the most recent data using whatever time range scale you’ve set. The information displayed will be the most recent happiness index, plus the trends over the most recent two days…sort of like a social happiness barometer. Because Watch complications and Lock Screen widgets may be monochrome only, the app uses line weights and styling for displaying each of the three years - a thick line for most recent, a thin solid line for a year ago, and a dashed line for two years ago. The “More information” page provides information about the University of Vermont’s Hedonometer project and a bit more information about the app itself. We hope you enjoy!
Latest release
What’s New
This app has been updated by Apple to prepare for watchOS 27 compatibility. No new features are included.
Audience growth
Ratings growth
Baseline captured. Growth appears after the crawler observes a changed rating count.
Momentum comes from crawler snapshots for the tracked storefront. “Viral growth signal” means unusually fast recent rating gains; it is an indicator, not download data.
Price tracking
Price intelligence
First snapshot captured. The trend line starts after the next crawler price observation.
- First observed Sep 2, 2026 · 6:30 AM Free
Screenshots