About this app
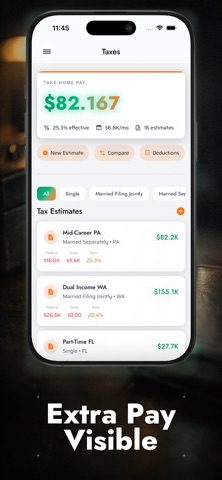
Your next job offer lands in your inbox. The number looks promising — eighty-five thousand a year. But what does that actually mean on a Friday afternoon when you check your bank account? After federal taxes, state taxes, retirement contributions, and health insurance, that impressive figure shrinks fast. And if your current job pays thirty-eight dollars an hour with overtime available, which deal actually puts more money in your pocket? Most people guess. They round numbers, forget about tax brackets, and make career decisions based on rough mental math. That approach works until it does not — until you accept a salaried position that pays less per hour than the job you left, or turn down overtime because you underestimated how much those extra hours actually contribute. This is a precision tool for real-world income math. ◆ Convert between hourly, daily, weekly, biweekly, monthly, and annual rates instantly — enter one number and see every breakdown side by side ◆ Estimate gross-to-net pay using current tax bracket approximations so you see what actually hits your bank account, not just the headline number ◆ Calculate overtime earnings at 1.5x and 2x multipliers to understand exactly what those extra shifts are worth before you commit to them ◆ Model raise scenarios by entering a percentage increase and immediately seeing the ripple effect across every pay period ◆ Combine multiple income streams into a single consolidated view — freelance gigs, part-time work, and your main salary all factored together ◆ Review take-home estimates with standard deductions already built in, cutting through the complexity of payroll math The interface strips away everything unnecessary. No account creation, no subscription walls, no thirty-screen onboarding tutorial. Enter your numbers, get your answers, make your decision. Whether you are comparing job offers, negotiating a raise, deciding if overtime is worth the trade-off, or simply trying to understand where your paycheck goes — accurate math changes the conversation. Stop guessing what you earn. Start knowing.
Latest release
What’s New
Critical Bug Fix
Audience growth
Ratings growth
Baseline captured. Growth appears after the crawler observes a changed rating count.
Momentum comes from crawler snapshots for the tracked storefront. “Viral growth signal” means unusually fast recent rating gains; it is an indicator, not download data.
Price tracking
Price intelligence
First snapshot captured. The trend line starts after the next crawler price observation.
- First observed Aug 20, 2026 · 2:24 PM Free
Screenshots