About this app
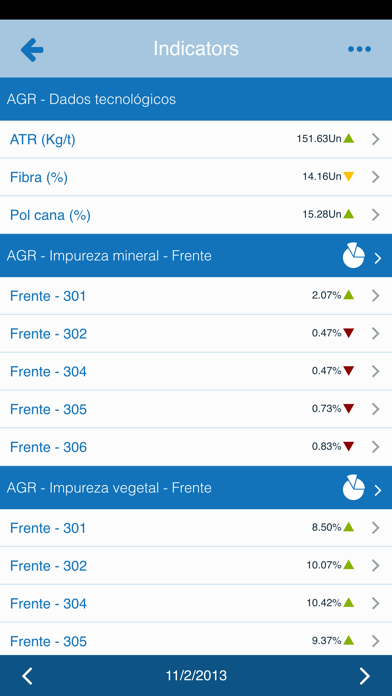
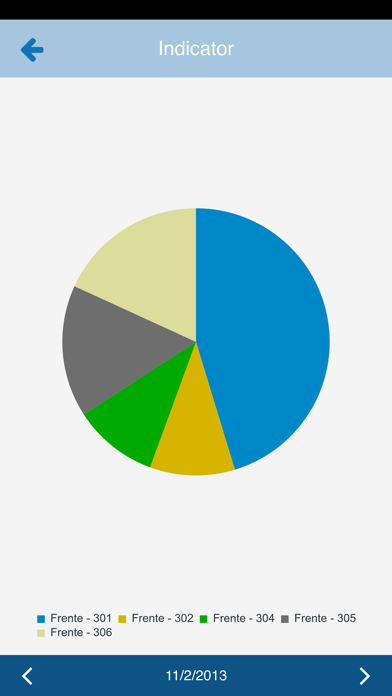
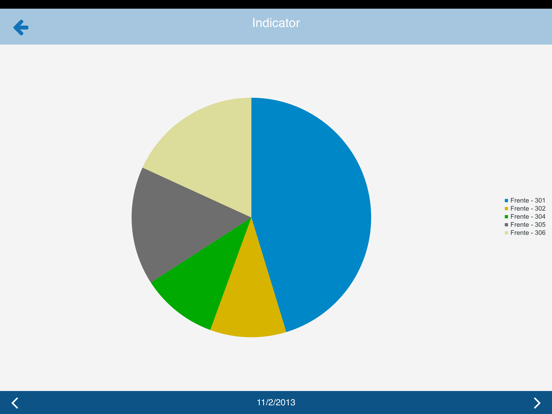
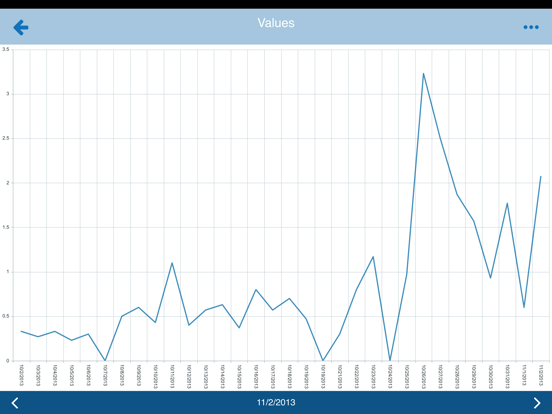
Make available the access to the information of your business with total security. Visualize your data in graphical formats through indicators and analyze the results anywhere you are. The Lynx Dashboard is designed to give you easy and convenient access to any type of daily, weekly, biweekly, monthly, six monthly or yearly indicator, may it be financial, administrative, technical or production. You can use information extracted from several types of available database, be it an ERP system or even Excel spreadsheets. This way, it is possible for managers to analyse information wherever they are. Key Features: • Flexibility to construct new queries. • Communication with any databases. • Ability to view bar charts, line or area for each indicator. • Possibility to include daily, weekly, biweekly, monthly, six monthly and yearly goals. • Inclusion of comments and observations on the indicators for visualization by the users. • Control access by the user. • Sending of e-mails with information of indicators in one touch. • Secure transmission of information. • Simple to use.
Latest release
What’s New
This app has been updated by Apple to prepare for watchOS 27 compatibility. No new features are included. - Usage of Quick Grids column configuration - Bug fix in panel opening
Audience growth
Ratings growth
Baseline captured. Growth appears after the crawler observes a changed rating count.
Momentum comes from crawler snapshots for the tracked storefront. “Viral growth signal” means unusually fast recent rating gains; it is an indicator, not download data.
Price tracking
Price intelligence
First snapshot captured. The trend line starts after the next crawler price observation.
- First observed Sep 1, 2026 · 2:45 AM Free
Screenshots