About this app
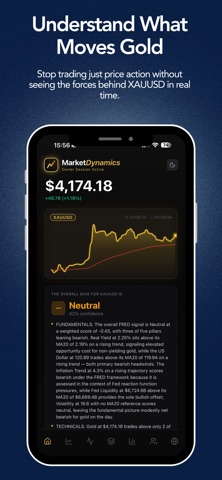
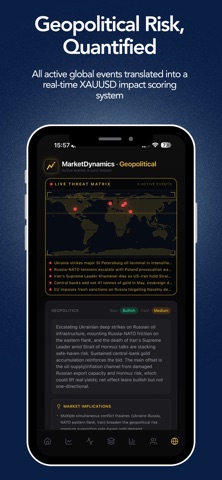
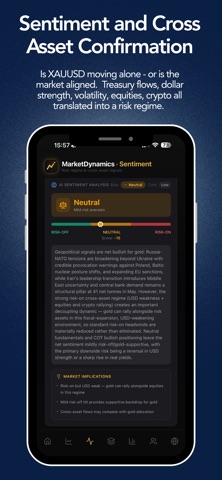
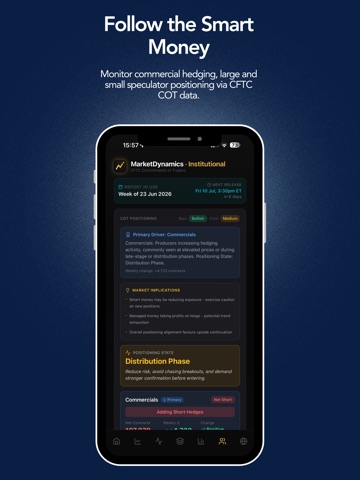
Institutional Gold Intelligence for XAUUSD Traders. MarketDynamics is a professional gold analysis engine built for serious traders who want to understand why gold moves — not just react to price candles. Instead of relying on isolated indicators, MarketDynamics integrates macro fundamentals, technicals, institutional positioning, cross-asset sentiment and geopolitical risk into one unified bias framework. - See the environment. - See the alignment. - Trade with context. NEW: DAILY TECHNICAL ANALYSIS Wake up to a professional XAUUSD technical breakdown published before the London open, every trading day. Daily, H4 and M30 timeframes woven into one coherent read: the range that matters, the clean-close triggers, the invalidation, and the plan — written like an analyst, not a printout. A deeper weekly breakdown lands every Sunday. NEW: PREDICT (H4 MODEL V1) A visual trade-setup view built from computed H4 levels — trigger, invalidation and target at a glance, with risk:reward calculated for you. When the honest answer is "wait for the range to resolve", it says exactly that. For educational purposes only. NEW: WEEKLY REPORT — FULLY AUTOMATIC One tap opens a detailed written report across all Gold Intelligence pillars — macro, positioning, geopolitics and technical structure — regenerated from live data every Sunday. No stale commentary, ever. NEW: TRACK RECORD Every published call is scored against real market data — wins and losses alike. The rolling record builds transparently inside the app. Conviction you can audit. NEW: ECONOMIC CALENDAR Red news for the week ahead delivered directly to the Fundamentals tab THE GOLD REGIME ENGINE Gold does not move randomly. It responds to: • Real yields and opportunity cost • Federal Reserve liquidity conditions • US dollar strength • Institutional positioning (CFTC COT data) • Cross-asset risk sentiment • Geopolitical risk premium • Multi-timeframe structural alignment MarketDynamics measures all of it — live — and translates dispersion into a clear directional bias with confidence scoring. A back-end rules engine does the heavy lifting, replacing hours of your own research. WHAT'S INSIDE Macro Fundamentals Dashboard — real yields, liquidity, inflation trend, volatility and dollar conditions, weighted into a live macro score for gold. Institutional Positioning (COT) — commercial hedging and speculator flows, so you see when institutional exposure is building or unwinding. Cross-Asset Sentiment Engine — Treasuries, equities, volatility, USD, crypto. Detect whether capital is rotating to safety or chasing risk. Geopolitical Risk Monitor — active global flashpoints, refreshed around the clock and evaluated for safe-haven impact. Technical Analysis — multi-timeframe trend, EMA alignment, momentum, daily range (ADR) and key levels including daily, weekly and session highs and lows. Understand expansion probability, exhaustion risk and prior session behaviour. WHY MARKETDYNAMICS IS DIFFERENT Most apps show charts. Some show indicators. Few connect the macro environment to price structure. MarketDynamics bridges macro drivers and technical execution — helping traders align with institutional conditions instead of trading blind. BUILT FOR • Gold (XAUUSD) traders • Prop firm and funded traders • Macro-aware swing traders • Intraday traders seeking context • Traders who want conviction, not noise Privacy Policy: https://www.strategydynamics.co.uk/privacy Terms of Use: https://www.apple.com/legal/internet-services/itunes/dev/stdeula/ * This app is for informational and educational purposes only. It does not constitute financial advice. Always conduct your own analysis and manage your risk appropriately.
Latest release
What’s New
New with 1.3.3 - Red news Economic Calendar added to fundamentals
Audience growth
Ratings growth
Baseline captured. Growth appears after the crawler observes a changed rating count.
Momentum comes from crawler snapshots for the tracked storefront. “Viral growth signal” means unusually fast recent rating gains; it is an indicator, not download data.
Price tracking
Price intelligence
First snapshot captured. The trend line starts after the next crawler price observation.
- First observed Aug 19, 2026 · 6:26 PM Free
Screenshots