About this app
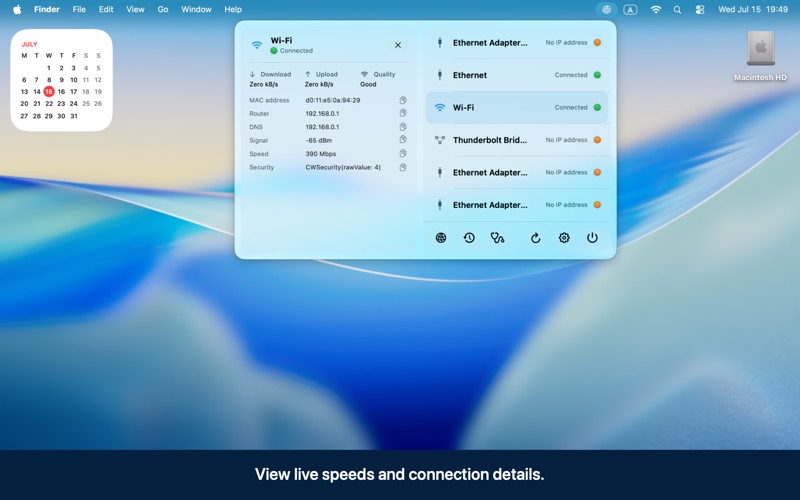
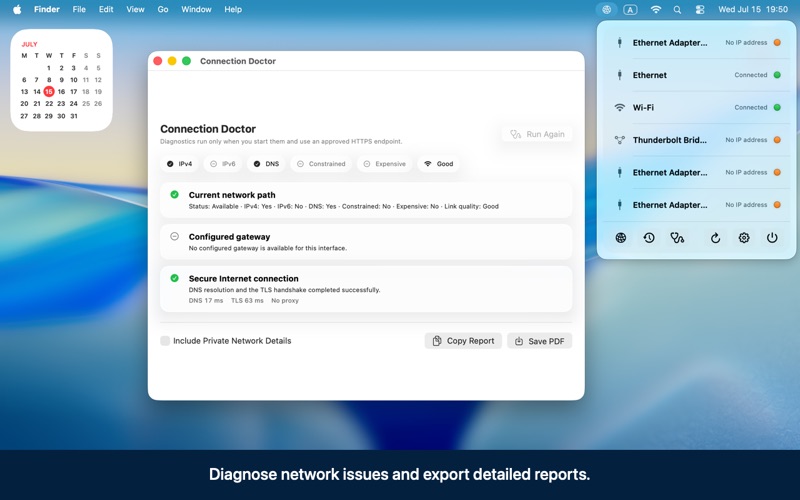
Network Connection Monitor is a lightweight menu bar utility that keeps your Mac's network status visible and easy to understand. See every configured network connection at a glance, including Ethernet, Wi-Fi, Thunderbolt Bridge, and other network services. Expand any connection to view useful details such as IP addresses, MAC address, router, DNS servers, Wi-Fi signal strength, connection speed, security, live download and upload rates, and link quality. KEY FEATURES • Clear menu bar status for all network connections • Live download and upload rates while the menu is open • Connection history with outages, recoveries, uptime, and total downtime • Optional notifications when a connection is lost or restored, or when the active interface changes • Connection Doctor for gateway, DNS, secure Internet connection, and proxy diagnostics • Shareable diagnostic reports in text, JSON, and PDF formats • Private network details are redacted from reports by default • Small and medium desktop widgets • Shortcuts and Spotlight actions for common tasks • Optional launch at login • Battery-saving modes, including automatic support for macOS Low Power Mode • English and Russian localization • Native support for Apple silicon and Intel Macs PRIVACY BY DESIGN Network monitoring stays on your Mac. The app does not include analytics and does not continuously contact an external server. An Internet connection test runs only when you explicitly start Connection Doctor. Location permission is optional and is requested only if you choose to reveal the connected Wi-Fi network name. Network Connection Monitor is designed for anyone who wants a fast, dependable view of their Mac's connectivity—from everyday users troubleshooting Wi-Fi to professionals monitoring several network interfaces.
Latest release
What’s New
• Custom status icon colors Pick your own colors for the connected and disconnected menu-bar icon states. Choices save automatically, with one-click restore to the default green and orange. Icon frames stay readable on both light and dark menu bars. • Richer widgets Small and medium widgets now show each interface's IP and MAC address, with a compact header that fits two connected adapters. The globe is replaced by the two-display status artwork, using the same connected/disconnected colors you set in the app. Wi-Fi and Ethernet icons follow your color choices too. Removed the refresh control and added more spacing between interfaces. • Live traffic chart Optional 60-second traffic chart in interface details, with thin incoming/outgoing bars and exact values on hover. Energy-aware, and it keeps history for all interfaces while enabled, so switching adapters shows data immediately instead of starting from zero.
Audience growth
Ratings growth
Baseline captured. Growth appears after the crawler observes a changed rating count.
Momentum comes from crawler snapshots for the tracked storefront. “Viral growth signal” means unusually fast recent rating gains; it is an indicator, not download data.
Price tracking
Price intelligence
First snapshot captured. The trend line starts after the next crawler price observation.
- First observed Aug 16, 2026 · 10:52 AM $2.99
Screenshots