About this app
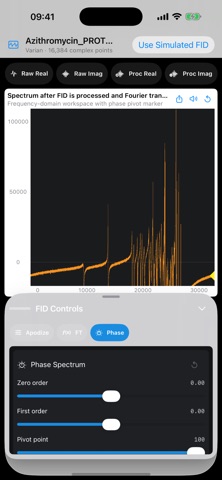
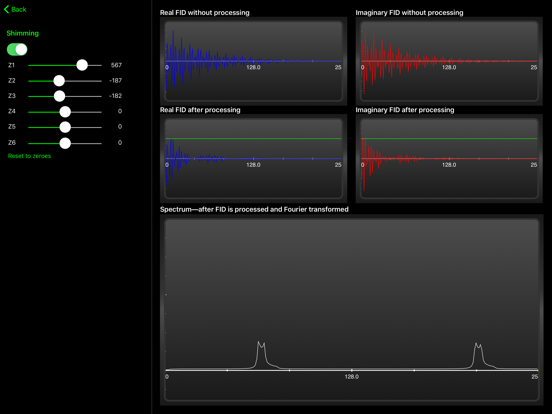
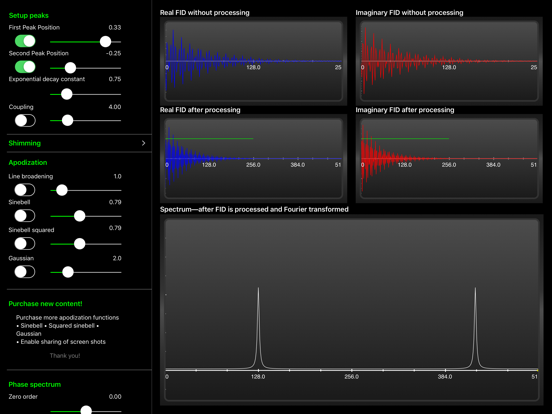
NMR Tutor is an interactive introduction to NMR data acquisition and signal processing. Use simulated free induction decays (FIDs) and spectra to explore how time-domain NMR signals become frequency-domain spectra. Adjust peak positions, decay, noise, apodization, zero filling, phase behavior, and common acquisition artifacts, then see the effect immediately in the FID and final spectrum. The app displays real and imaginary FID channels before and after processing, together with the resulting spectrum after Fourier transformation. A live signal-to-noise (S/N) measurement updates as you adjust noise, scan averaging, apodization, FID artifacts, and shimming, making processing tradeoffs easy to compare. Apply zero filling to see how digital interpolation changes the appearance of the spectrum without adding new measured data. You can also introduce common receiver or acquisition faults into the FID and observe the artifacts that appear after processing. As an advanced example, add spin-spin coupling to create an AB coupling pattern, then move the peaks or change the coupling strength to compare AB behavior with an AX spin system. Charts retain every data point and support pan, zoom, phase-pivot dragging, graph audio, sharing and export, and external displays. Optimized Metal and Accelerate processing keeps high-resolution chart and shimming interactions responsive. Adaptive layouts and larger accessibility text make the workspace easier to use on iPhone, iPad, and Mac. Open one-dimensional JEOL, Bruker and Varian FID datasets directly. Inspect the acquired real and imaginary channels, then apply apodization, zero filling, first-point scaling, and zero- and first-order phase correction to your own data.
Latest release
What’s New
• Native JEOL JDF import. Open and process JEOL JDF files directly alongside Varian and Bruker datasets, with automatic digital-filter delay correction. Many thanks, Uli. I greatly appreciate your support. • Enhanced chart tools. New Pan, X/Y Zoom, Box Zoom, and Reset View controls work smoothly with touch, mouse, and trackpad input. Settings persist for each chart, and scaling is more precise. • Bruker digital-filter correction. Automatic correction for Bruker receiver delays improves peak shapes and baseline fidelity, with optional manual fine-tuning. • A more polished user interface and other improvements.
Audience growth
Ratings growth
Baseline captured. Growth appears after the crawler observes a changed rating count.
Momentum comes from crawler snapshots for the tracked storefront. “Viral growth signal” means unusually fast recent rating gains; it is an indicator, not download data.
Price tracking
Price intelligence
First snapshot captured. The trend line starts after the next crawler price observation.
- First observed Aug 19, 2026 · 10:12 AM Free
Screenshots