About this app
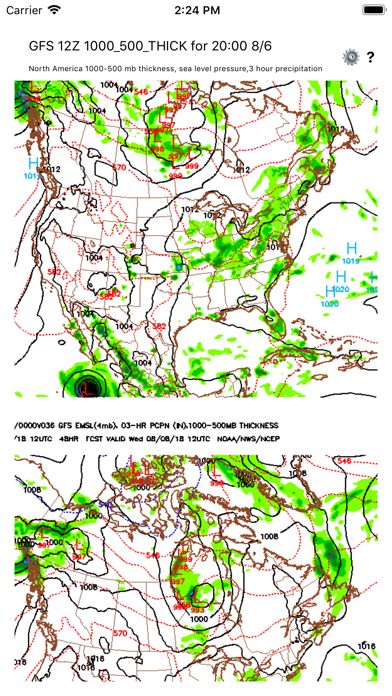
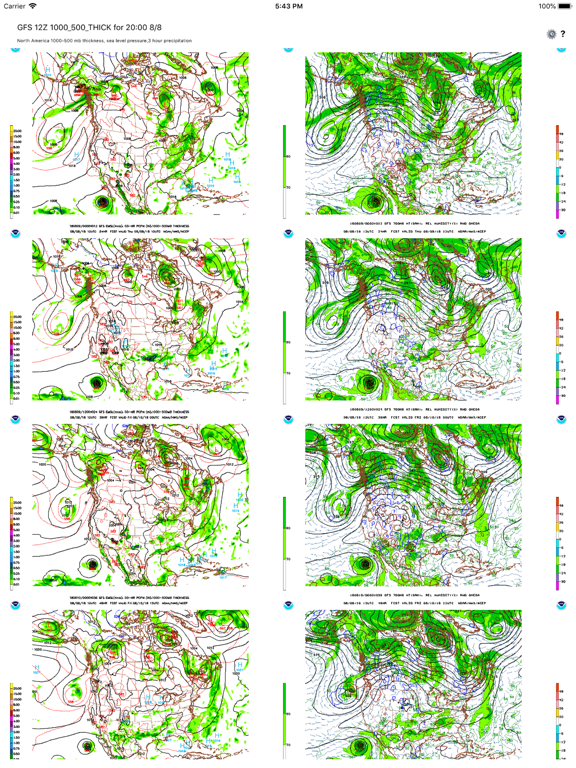
The NOAA Forecast app collects and displays weather maps produced by NOAA's Global Forecast System (GFS). The maps are displayed in a scrollable and zoomable grid. The vertical axis of the grid is forecast time. Four different forecasts are displayed at 12 hour time intervals. The horizontal axis of the grid is different types of forecasts - five different types of maps can be selected from among 21 possible map types. The maps are available for thirteen different regions of the globe. These maps are the raw maps produced by the GFS computer model. The maps and the data contained in the maps are processed and interpreted by other weather services to produce the maps seen in the newspaper and on TV.
Latest release
What’s New
Display an animated map combining the four time periods along the vertical axis
Audience growth
Ratings growth
Baseline captured. Growth appears after the crawler observes a changed rating count.
Momentum comes from crawler snapshots for the tracked storefront. “Viral growth signal” means unusually fast recent rating gains; it is an indicator, not download data.
Price tracking
Price intelligence
First snapshot captured. The trend line starts after the next crawler price observation.
- First observed Aug 21, 2026 · 12:21 PM Free
Screenshots