About this app
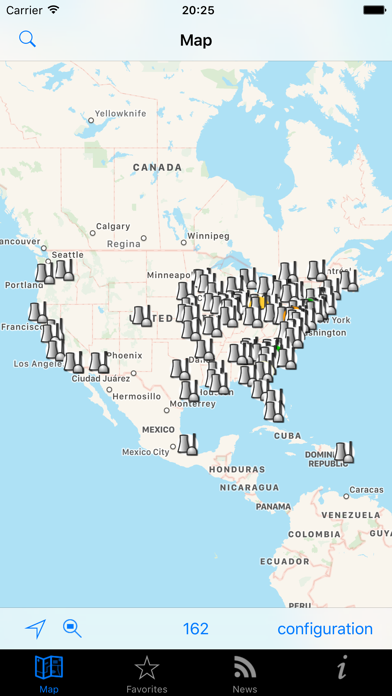
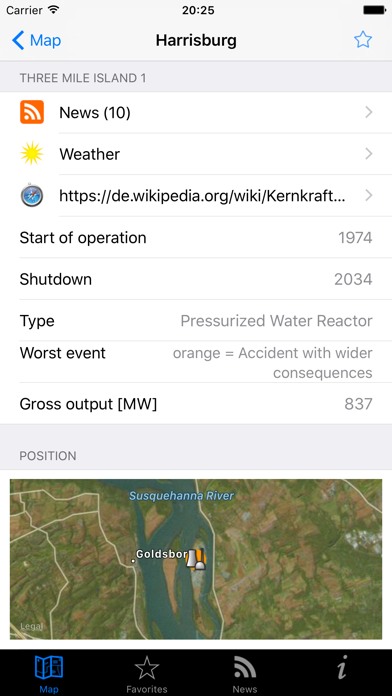
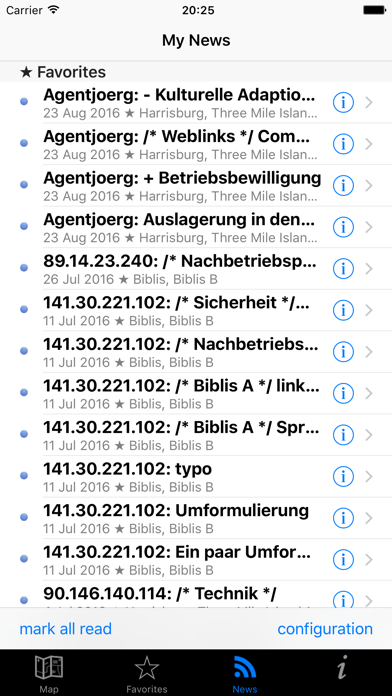
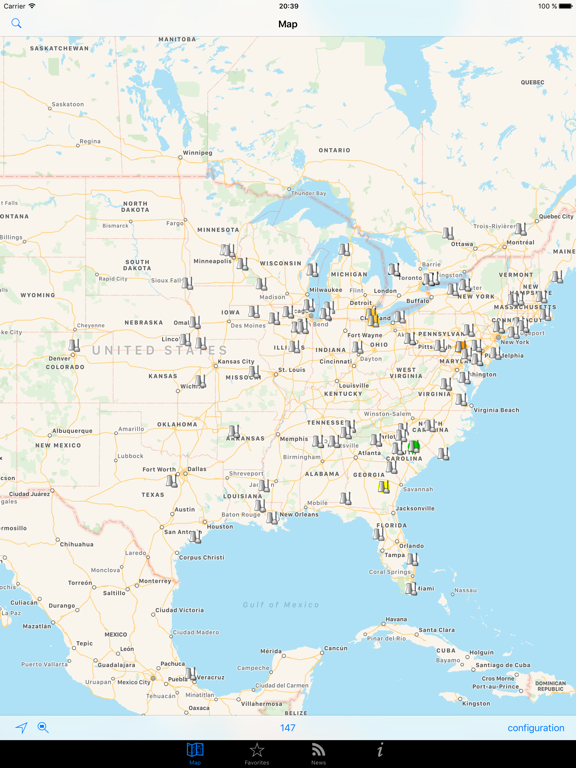
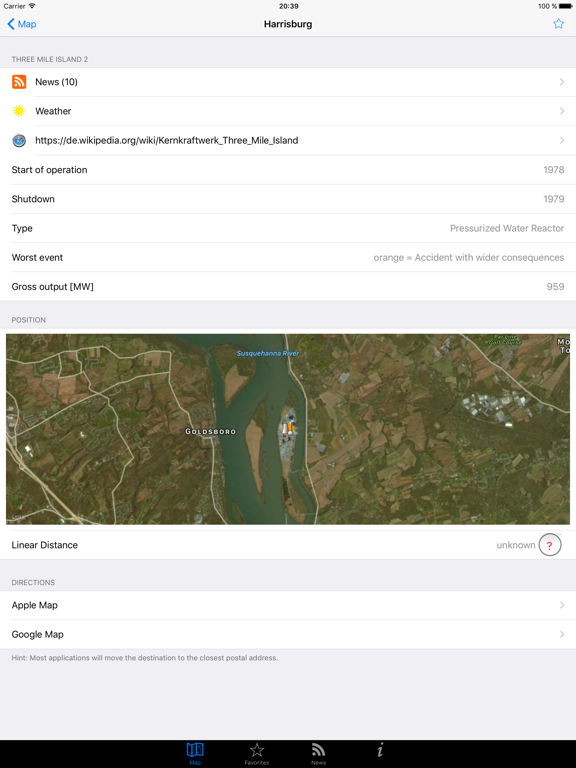
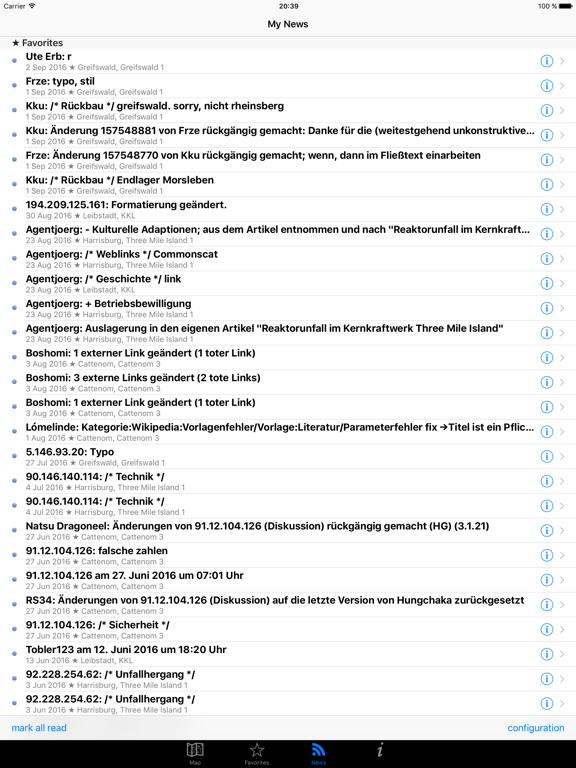
Check out this ad-free map of nuclear power plants worldwide and get an idea of how many there are already. The following arithmetic made me create this app: Scientists keep claiming that a worst-case scenario will happen only every 10,000 years. Sounds acceptable? It is an estimate for one nuclear power plant - but there are about 400 worldwide. Fukushima could have been anticipated by doing this calculation: 1986 + (10,000 / 400) = 2011. Who can say now it has been unpredictable? Accidents that were classified on the INES scale appear as colored circles. White = no events; up to dark red = catastrophy. Each location provides information about • start of operation, year of planned shutdown • gross output • in-depth information on mobile wikipedia page • news (wikipedia page history) • overview of recent wikipedia changes • worst recorded event (INES scale) • type of reactor • circle with configurable radius can be drawn around each plant Thanks to Chris, CCM and especially my brother Ralf for helping me compiling the data.
Latest release
What’s New
This update from Apple will improve the functionality of this app. No new features are included. iOS 10 Bugfix
Audience growth
Ratings growth
Baseline captured. Growth appears after the crawler observes a changed rating count.
Momentum comes from crawler snapshots for the tracked storefront. “Viral growth signal” means unusually fast recent rating gains; it is an indicator, not download data.
Price tracking
Price intelligence
- First observed Aug 22, 2026 · 3:47 PM Free
Screenshots