About this app
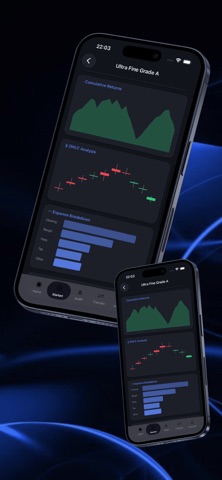
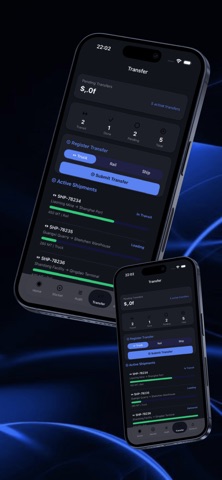
We are a comprehensive market data management platform designed for professional market strategy development. This application provides market professionals with a complete set of tools, displaying real-time market quotes and sorting various powder grades by price change and volume. Users can access detailed price analysis, including interactive line charts showing 30-day price trends and bar charts of volume distribution for each track. The platform is equipped with a powerful simulation testing system, allowing users to submit new simulation reports and track market analysis results, as well as complete historical records and grade distribution visualizations, providing real-time progress indicators and market overviews. A curated watchlist feature allows users to track selected market data and provides summarized performance summaries, making data exploration both informative and engaging.
Audience growth
Ratings growth
Baseline captured. Growth appears after the crawler observes a changed rating count.
Momentum comes from crawler snapshots for the tracked storefront. “Viral growth signal” means unusually fast recent rating gains; it is an indicator, not download data.
Price tracking
Price intelligence
First snapshot captured. The trend line starts after the next crawler price observation.
- First observed Aug 19, 2026 · 7:09 AM Free
Screenshots