About this app
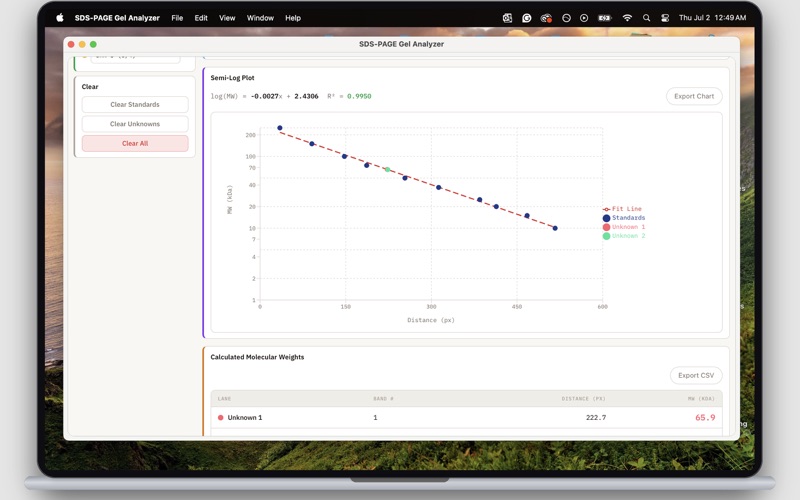
SDS-PAGE Gel Analyzer is a powerful scientific tool designed for researchers, students, educators, and laboratory professionals who need to determine protein molecular weights from polyacrylamide gel electrophoresis images quickly and accurately. The application simplifies gel analysis by allowing users to upload gel images, mark protein standards and unknown bands, generate semi-log regression curves, and calculate molecular weights in real time. Advanced image enhancement tools, automatic band detection, multiple sample lane support, and publication-ready exports make the workflow efficient and reliable. Whether you are conducting protein characterization, teaching electrophoresis techniques, or preparing publication-quality figures, SDS-PAGE Gel Analyzer provides the tools you need in a modern and intuitive interface. FEATURES Upload SDS-PAGE gel images in common image formats Determine molecular weights using semi-log regression analysis Interactive band marking with smart auto-centering Automatic standard band detection with adjustable sensitivity Real-time molecular weight calculations Support for multiple unknown sample lanes Draggable markers for precise band positioning Built-in protein ladder support with custom ladder options Brightness and contrast adjustment tools Keystone and trapezoid correction for angled gel images Multiple image display modes including grayscale and heatmap Standard curve visualization with regression equation and R² values Dark mode interface optimized for laboratory environments Export annotated gel images, standard curves, and CSV reports SCIENTIFIC ANALYSIS The analyzer uses the established SDS-PAGE relationship between protein migration distance and molecular weight. A semi-logarithmic regression curve is generated using known protein standards: Unknown protein molecular weights are calculated automatically using the fitted regression equation. The application also reports the coefficient of determination (R²) to help evaluate standard curve quality and analysis reliability. WORKFLOW Upload a gel image. Select a molecular weight standard ladder. Define the gel origin. Mark standard protein bands. Mark unknown protein bands. Review molecular weight calculations. Export figures and data for publications, reports, or further analysis. IDEAL FOR Molecular biology laboratories Biochemistry researchers Protein analysis workflows Academic teaching laboratories Undergraduate and graduate students Biotechnology professionals Life science educators Transform gel images into accurate molecular weight measurements with a streamlined workflow designed for modern protein analysis.
Latest release
What’s New
The app icon is fixed and screenshots are changed.
Audience growth
Ratings growth
Baseline captured. Growth appears after the crawler observes a changed rating count.
Momentum comes from crawler snapshots for the tracked storefront. “Viral growth signal” means unusually fast recent rating gains; it is an indicator, not download data.
Price tracking
Price intelligence
First snapshot captured. The trend line starts after the next crawler price observation.
- First observed Oct 6, 2026 · 11:52 PM Free
Screenshots