About this app
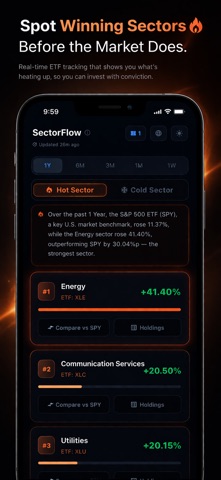
Which sectors are beating the market right now? SectorFlow gives you the answer instantly. See which stock market sectors are outperforming or underperforming the S&P 500 benchmark, ranked by a proprietary momentum score across multiple timeframes. Stop guessing where the money is flowing. SectorFlow analyzes sector ETF performance and delivers a clear hot-to-cold ranking so you can spot market rotation trends at a glance. KEY FEATURES - Hot and Cold Sector Rankings: Every major sector ETF is scored and ranked against SPY. Positive scores mean the sector is beating the market. Negative scores mean it is lagging behind. - Multi-Timeframe Analysis: Switch between 1 week, 1 month, 3 month, 6 month, and 1 year intervals to see how sector momentum shifts over time. - Side-by-Side Chart Comparison: Compare any sector ETF directly against the S&P 500 on an interactive dual-axis candlestick chart. Touch the chart to see exact price data at any point. - Top Holdings Breakdown: Drill into any sector ETF to see its top holdings, including each stock name, industry, and portfolio weight percentage. - Market Summary: Get a quick overview of overall market conditions and sector dispersion. WHO IS THIS FOR - Active investors tracking sector rotation strategies - Swing traders looking for momentum shifts across industries - Portfolio managers evaluating sector allocation decisions - Anyone who wants to understand where money is flowing in the market HOW TO USE 1. Open the app and see sectors ranked from hottest to coldest 2. Tap any sector to compare its chart against the S&P 500 3. Switch timeframes to confirm whether momentum is building or fading 4. Check holdings to see which stocks are driving sector performance Download SectorFlow and start making smarter sector-level investment decisions today.
Latest release
What’s New
Fix metadata
Audience growth
Ratings growth
Baseline captured. Growth appears after the crawler observes a changed rating count.
Momentum comes from crawler snapshots for the tracked storefront. “Viral growth signal” means unusually fast recent rating gains; it is an indicator, not download data.
Price tracking
Price intelligence
First snapshot captured. The trend line starts after the next crawler price observation.
- First observed Aug 11, 2026 · 7:32 PM Free
Screenshots