About this app
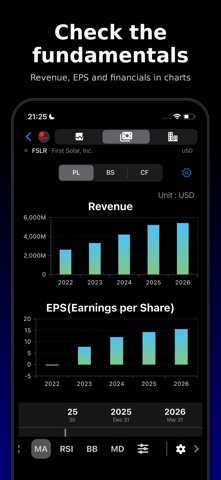
Quickly grasp the full picture of the US stock market with an intuitive heatmap. KEY FEATURES: - Sector Heatmap — Visualize performance across all 11 sectors with color-coded tiles - Industry Drilldown — Explore from sectors to industries to individual stocks - Top Gainers & Losers — Instantly discover the most notable movers - Global Markets — View ETF performance across major world markets - Multiple Timeframes — Compare and analyze from 1 day to 1 year - Stock Details — Charts, technical indicators, and trade simulations Perfect for tracking sector rotation and verifying portfolio diversification across industries.
Latest release
What’s New
We have made improvements and fixed bugs to make your experience even better.
Audience growth
Ratings growth
Baseline captured. Growth appears after the crawler observes a changed rating count.
Momentum comes from crawler snapshots for the tracked storefront. “Viral growth signal” means unusually fast recent rating gains; it is an indicator, not download data.
Price tracking
Price intelligence
First snapshot captured. The trend line starts after the next crawler price observation.
- First observed Sep 12, 2026 · 4:08 AM Free
Screenshots