About this app
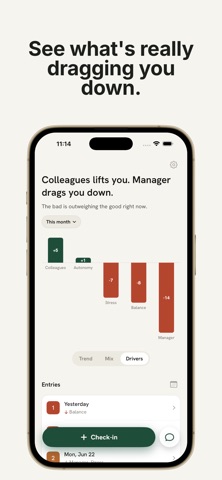
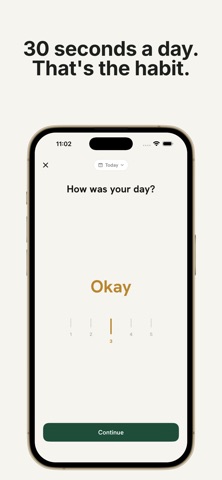
Some days you want to walk out. Other days it's fine. So which is it — a rough patch or the wrong job? Should I Quit? helps you answer that with evidence instead of a 3am gut feeling. It's not advice from strangers, and it's not a blank page to fill. It's a 30-second daily check-in that quietly turns how work actually feels into a clear picture over time. So you can tell burnout from boredom, a bad week from a bad fit, and your own head from your actual situation. HOW IT WORKS • Check in — 30 seconds. Rate the day and tag what lifted it or dragged it down: manager, workload, pay, autonomy. • Watch the trend — getting better, holding flat, or quietly sliding? • See your drivers — the one or two things that really move your days. • Get a second opinion — an honest read on your own data, whenever you're stuck. WHO IT'S FOR • Burned out, and not sure if it's you or the job. • Golden handcuffs — the pay is good, the days are not. • Bored and stalled, watching the months blur together. • A boss or a culture that's slowly wearing you down. WHY IT WORKS One bad meeting isn't a reason to quit. A six-month slide might be. Most people decide on their worst day — this lets you decide on the trend. Quietly and privately, on your phone. Your entries stay yours. Terms of Use (EULA): https://www.apple.com/legal/internet-services/itunes/dev/stdeula/ Privacy Policy: https://siq-legal.kildegaardp.workers.dev/privacy
Latest release
What’s New
• New “Mastery” factor — track whether you're getting good at your craft, not just whether you're going anywhere • Picking your score scale is clearer: see 1–3, 1–5 or 1–10 and preview how it feels before you choose • Nothing to log that day? Skipping what lifted or dragged your day is now one tap
Audience growth
Ratings growth
Baseline captured. Growth appears after the crawler observes a changed rating count.
Momentum comes from crawler snapshots for the tracked storefront. “Viral growth signal” means unusually fast recent rating gains; it is an indicator, not download data.
Price tracking
Price intelligence
First snapshot captured. The trend line starts after the next crawler price observation.
- First observed Aug 11, 2026 · 7:42 PM Free
Screenshots