About this app
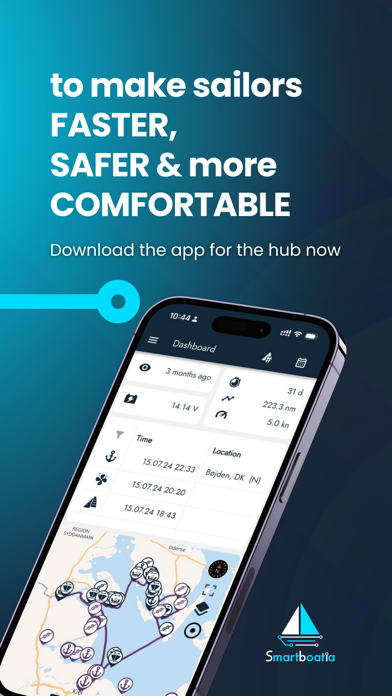
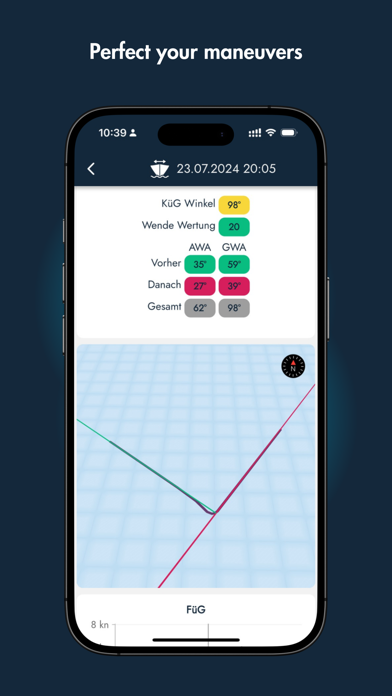
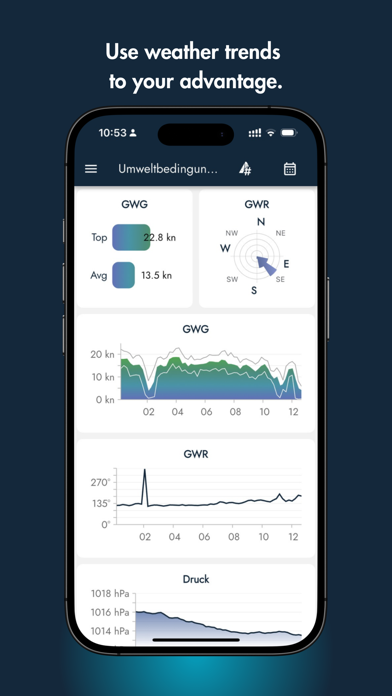
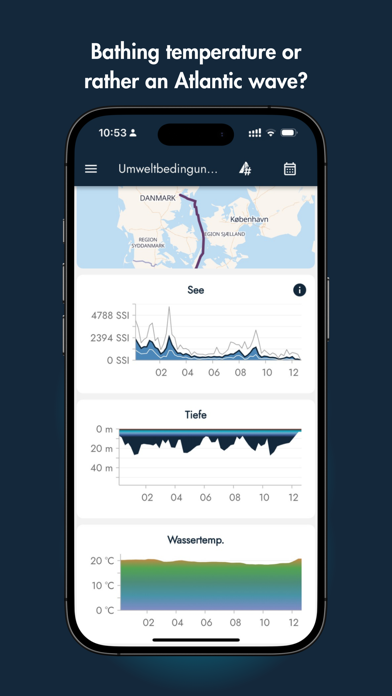
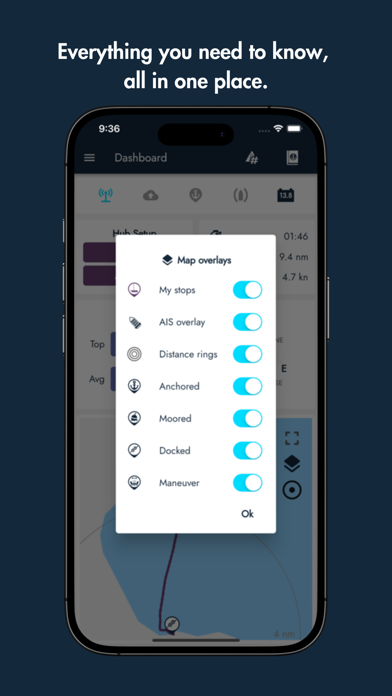
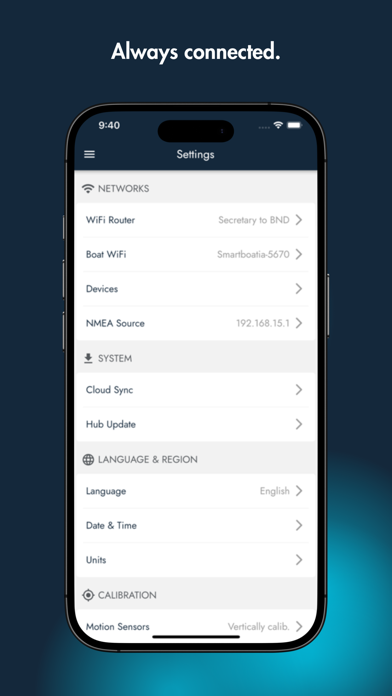
Boats collect a wealth of valuable data, but it often goes unused... until now! Smartboatia offers a powerful and intuitive app that connects you to the heart of your sailing vessel - an intelligent Smartboatia Hub that collects, analyzes, and monitors all the vital data from your boat's sensors, both onboard and external. With Smartboatia, you'll never have to guess at the wind speed, course, depth, or GPS position again. Instead, you'll have all the information you need, right at your fingertips, in real-time and you’ll even get historical data. But Smartboatia is more than just a new piece of electronic. It's a mission to reimagine the pleasure sailing experience. Our team of passionate sailors and technology enthusiasts have created a tool that allows every sailor to optimize their boat handling and maintenance, and to share their seafaring adventures with friends and family, both on and off the water. Whether you're a seasoned sailor or a newcomer to the sport, Smartboatia has something for everyone. With Smartboatia, you can access your boat's data from anywhere, and even take your loved ones on a virtual journey with you. So why wait? Download Smartboatia now and join the revolution in sailing technology!
Latest release
What’s New
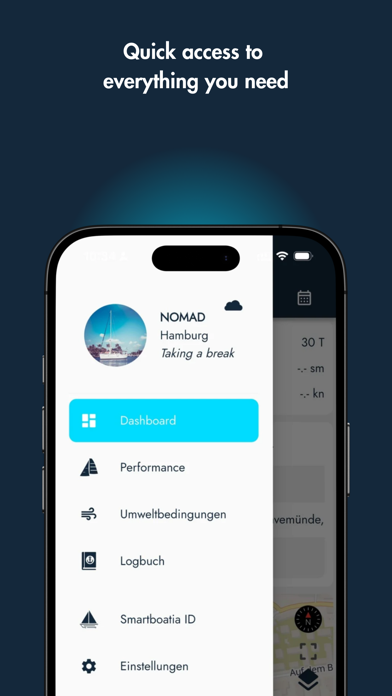
Version 1.44.0 This release is about seeing more, more clearly. The Plotter gains two performance widgets, Alarms get their own dedicated screen, and connection and sync status get an overhaul across the app. The Plotter: Two new widgets join your instrument panel. Target VMG shows how efficiently you're sailing toward your polar's optimum, and VMG to Waypoint shows your closing speed toward your next mark. The instrument panel now defaults to a clean one-column layout, and on tablets in landscape mode the map sits beside your monitoring widgets instead of below them. Also new: - Alarms now have their own dedicated screen, reachable directly from the main menu: see every alarm you've set in one place and switch any of them on or off without digging through other screens. The screen also remembers which sections you had expanded or collapsed. - The old Dashboard screen for Hub connections has been removed to simplify the app - A toast now lets you know when your Hub is running a version older than 1.43 Reliability: - Connections between the app and your Hub are noticeably more stable, with fewer dropouts and faster recovery - A new sync status popup on the Hub connection indicator shows exactly how current your data is - Cloud sync timestamps are now labeled "Live/Full Sensor Data Synced Until" for clarity - The cloud connection icon now uses color to show live versus stale data, with a detail popup - A new connection type indicator shows at a glance whether you're connected locally or remotely Bug fixes: - Fixed: Boat Monitoring showed a permanent placeholder instead of local data for a Hub never registered to the cloud - Fixed: Boat Monitoring showed an empty placeholder for several seconds when connecting to a freshly set up Hub - Fixed: the autopilot's steering mode display got stuck on heading control for wind and no-drift modes - Fixed: action icons in the app bar used inconsistent spacing across different screens - Fixed: Remote Monitoring sometimes kept showing stale data if the screen stayed open for a while - Fixed: connecting to a boat could briefly resolve to the wrong local Hub during the connection transition - Fixed: the wind direction chart could show incorrect or flattened values due to a caching issue - Fixed: cloud sensor data lost during a brief disconnect wasn't always replayed once reconnected, leaving cards blank - Fixed: the sync status for a local-only Hub connection could lag behind by several seconds after connecting Fair winds!
Audience growth
Ratings growth
Baseline captured. Growth appears after the crawler observes a changed rating count.
Momentum comes from crawler snapshots for the tracked storefront. “Viral growth signal” means unusually fast recent rating gains; it is an indicator, not download data.
Price tracking
Price intelligence
First snapshot captured. The trend line starts after the next crawler price observation.
- First observed Aug 19, 2026 · 7:41 PM Free
Screenshots