About this app
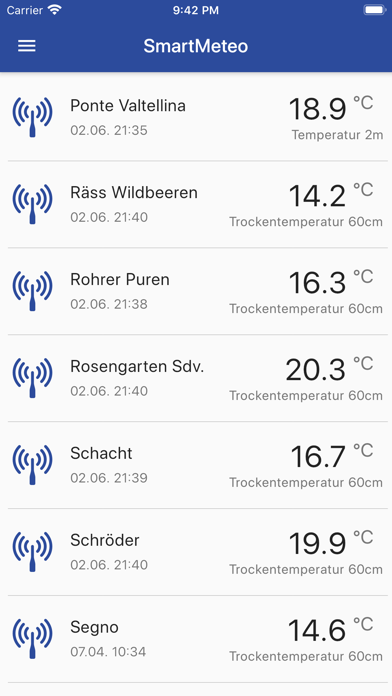
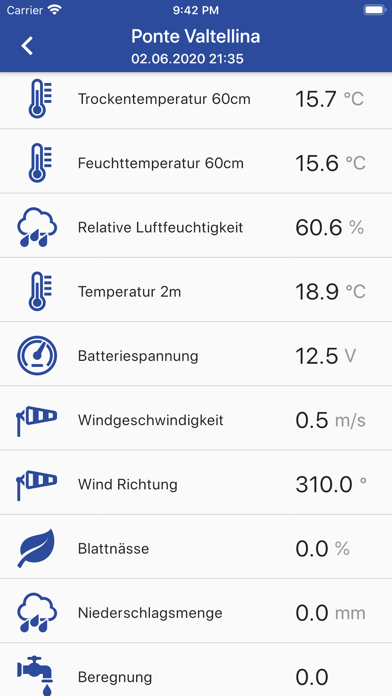
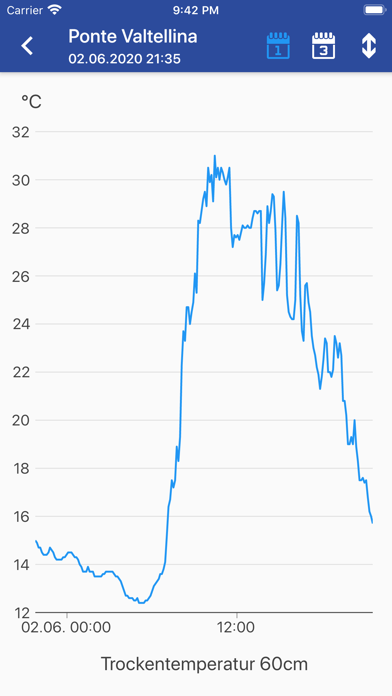
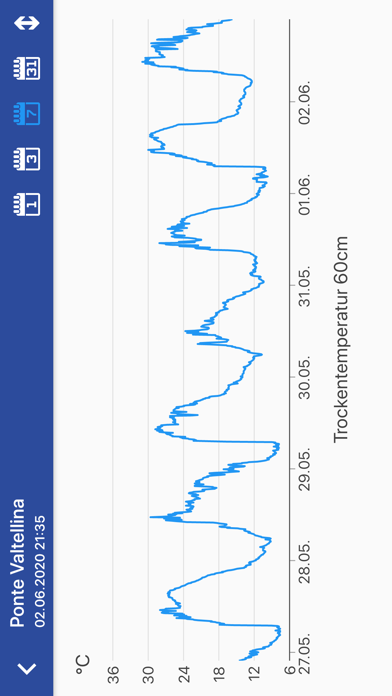
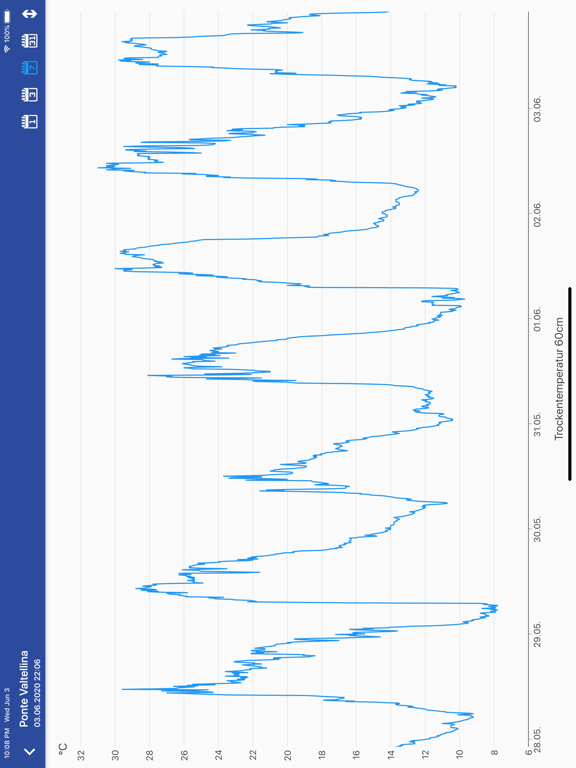
Angezeigt werden sämtliche zugeordneten Wetterstationen. Für jede Station werden für sämtliche Sensoren die Echtzeitwerte und historische Daten über Grafiken angezeigt.
Latest release
What’s New
Version 1.3.1
Jun 8, 2026
Verbesserung der Anwendung.
Audience growth
Ratings growth
7-day gain
+0
Ratings / day
0.0
30-day gain
+0
Baseline captured. Growth appears after the crawler observes a changed rating count.
Momentum comes from crawler snapshots for the tracked storefront. “Viral growth signal” means unusually fast recent rating gains; it is an indicator, not download data.
Price tracking
Price intelligence
Current
Free
Historical low
Free
Paid → free
0×
First snapshot captured. The trend line starts after the next crawler price observation.
- First observed Aug 23, 2026 · 1:42 PM Free
Screenshots