About this app
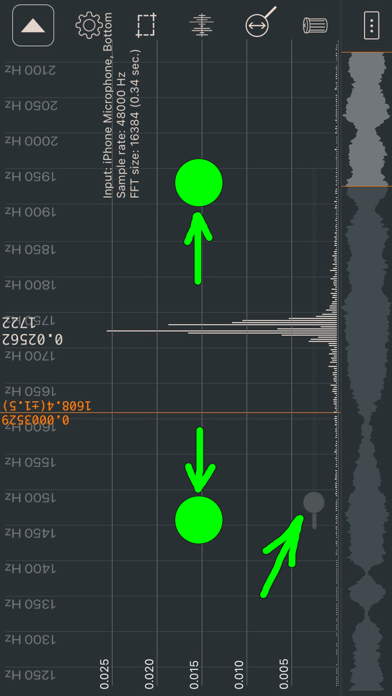
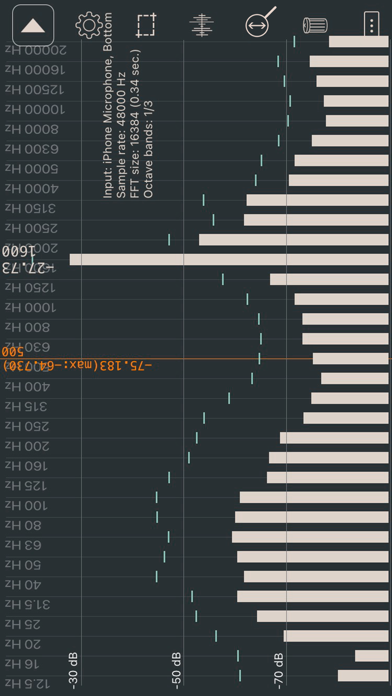
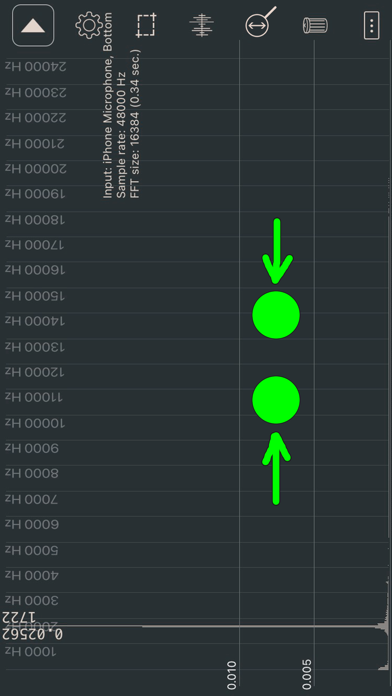
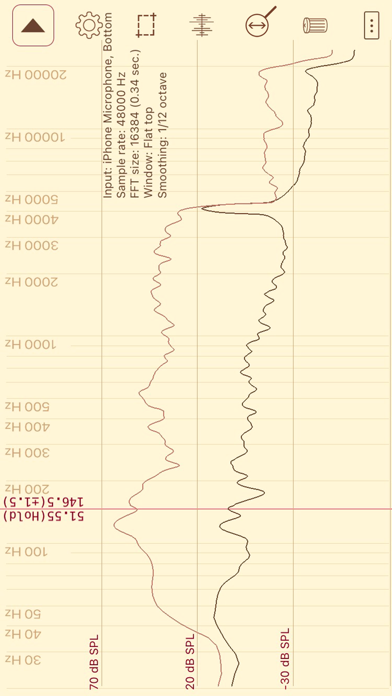
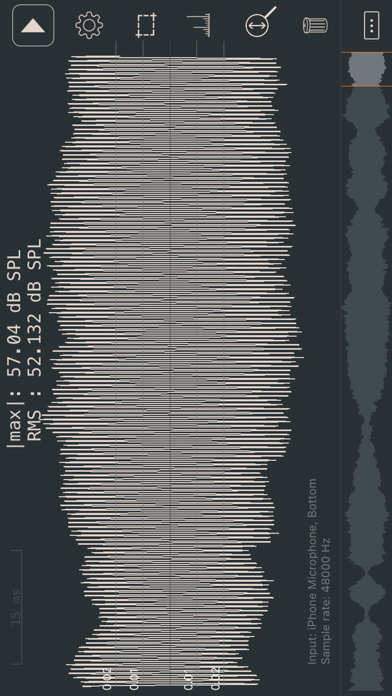
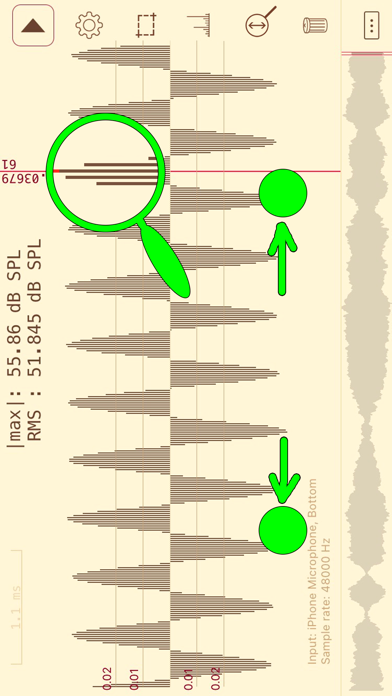
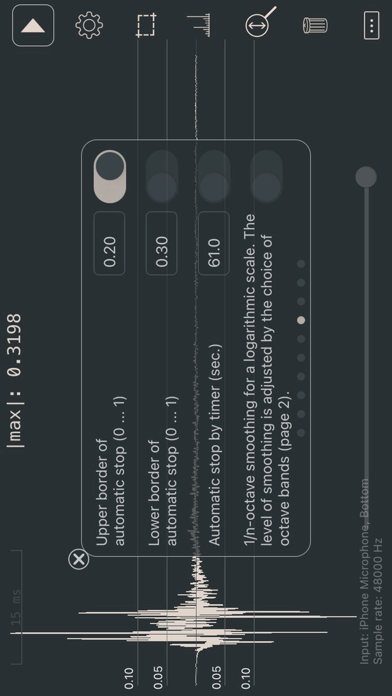
The application is designed for analysis of a sound spectrum in real time (with a microphone). Besides, the application can be used as a measuring instrument of noise level (not for exact measurements). • Sound wave. • Fast fourier transform (FFT). FFT size: 2048 (the accuracy of determining the frequency of ±12 Hz), 4096 (±6 Hz), 8192 (±3 Hz), 16384 (±2 Hz), 32768 (±1 Hz), 65536 (±0.5 Hz), 131072 (±0.2 Hz). • Linear and logarithmic frequency scale. • Linear frequency scale with maximum details (there is a choice for the displayed frequency range). • Linear and logarithmic amplitude scale. • Octave bands (1/1, 1/3, 1/6, 1/12). • Window functions (Blackman, Hamming, Hann (Hanning), Blackman–Nuttall, Gaussian, Flat top). • A- and C-Weightings. • Peak hold. • Exponential spectrum averaging. • Peak frequency detection. • Values of any point (for frequency scale and sound wave (at maximum detail)). • Sound level meter (dB SPL). You can calibrate your microphone by launching a signal generator with a sinusoid frequency of 1000 Hz on another device and making the volume very low. When the sound is almost inaudible, it is necessary to find the amplitude for the frequency of 1000 Hz on the spectrum (FFT size: 16384). This value should be multiplied by 1.2 (to compensate for spectral leakage). It will be the reference value for your microphone. ESTIMATE THE TOTAL NOISE LEVEL BY USING THE SOUND WAVE MODE AT THE MAXIMUM VALUE. • Sample rate: 48000 Hz. • Taking a screenshot by lightly touching the screen. • Export data to a WAV or text file ("Y=[y1 y2... yn]", "y1;y2;... yn", "x1;y1\nx2;y2;..."). Number of points is adjusted via "FFT size". • Automatic stop in the sound wave mode (when increasing or decreasing signal strength). • Automatic stop in the spectrum mode. Now you can stop data collection when the start of the fading signal reaches the end of the FFT buffer. The beginning of the signal is not calculated accurately (just like with an automatic stop in the sound wave mode). • Test wave. • Saving the measurement results in the application. Files with saved data (SavedData_[date]_[time].txt) can be copied to a desktop/laptop computer or transferred to another iPhone using iTunes. There are buttons for quick loading and comparing saved files. • Dark theme. • List of frequency peaks. If several peaks have a common base, then they are considered as one peak. The minimum height of the peak for octave bands is 2 dB. • Interpolation of frequencies in the list of peaks. To interpolate the frequency of the peak, select the Gaussian window (the accuracy of determining the frequency can increase by 10-100 times). The calculation is not done for the extreme bins or if the adjacent bin is zero. • Calculation of the amplitude (in the list of peaks) using neighboring bins (to compensate for spectral leakage and use of the window). The number of bins used for calculation is written in brackets. • Collecting recent data (last minute). You can move over all collected data. The amplitude of the waveform can be changed in the sound wave mode. • Calibration file. The app recognizes only files for the UMIK-1 microphone, but you can specify which microphones you need support for.
Latest release
What’s New
The app has been updated only to answer new age rating questions.
Audience growth
Ratings growth
Baseline captured. Growth appears after the crawler observes a changed rating count.
Momentum comes from crawler snapshots for the tracked storefront. “Viral growth signal” means unusually fast recent rating gains; it is an indicator, not download data.
Price tracking
Price intelligence
First snapshot captured. The trend line starts after the next crawler price observation.
- First observed Sep 8, 2026 · 9:50 PM Free
Screenshots