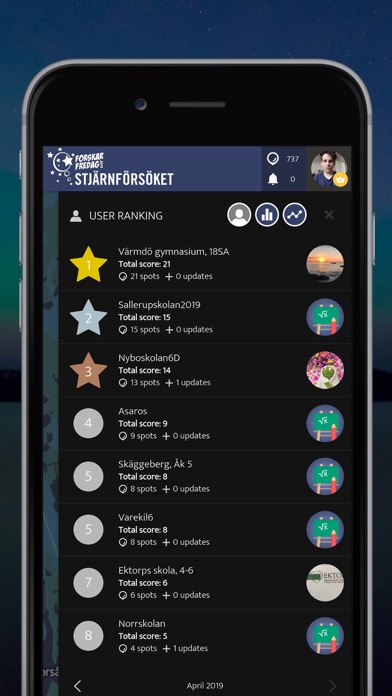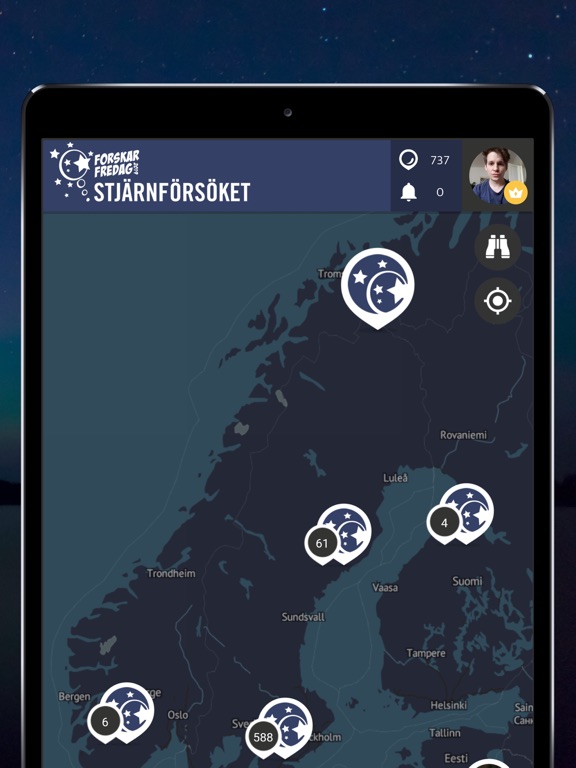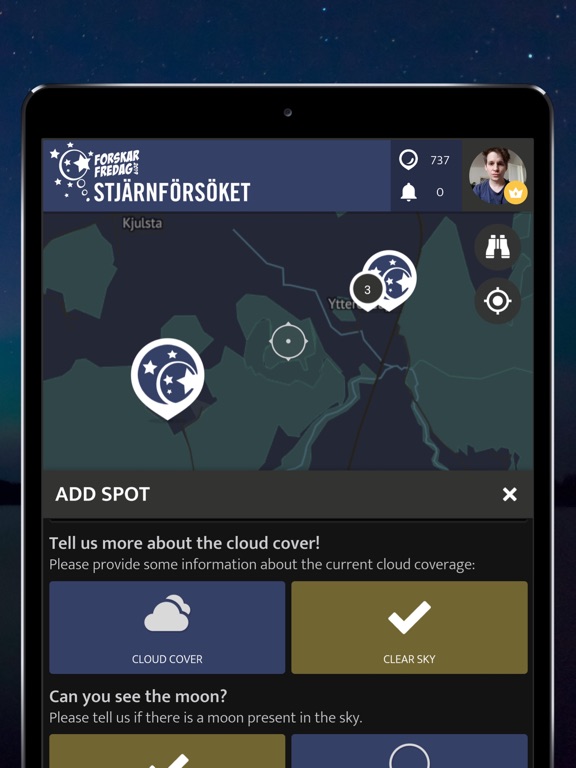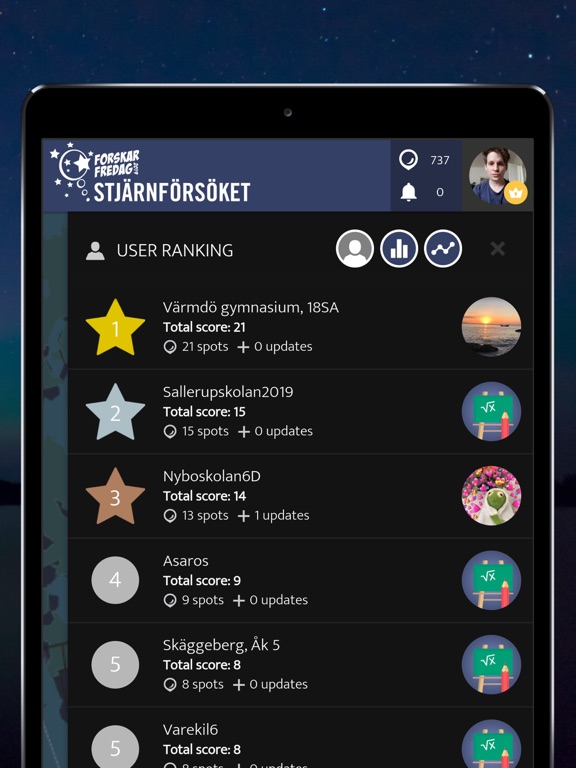
About this app
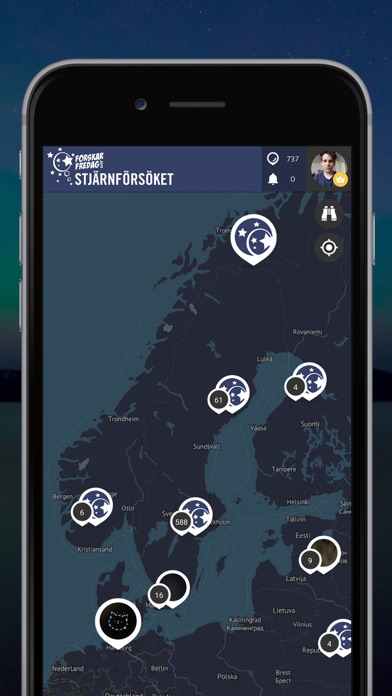
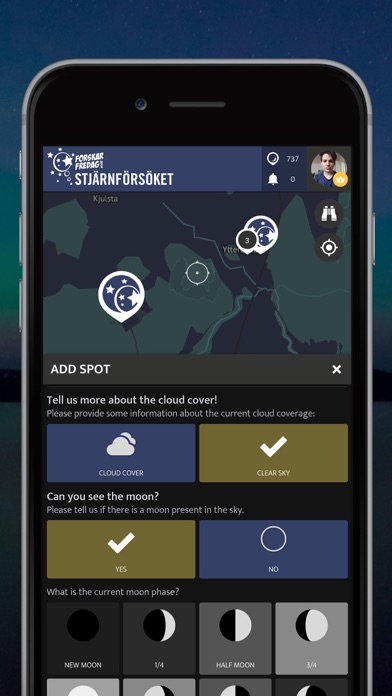
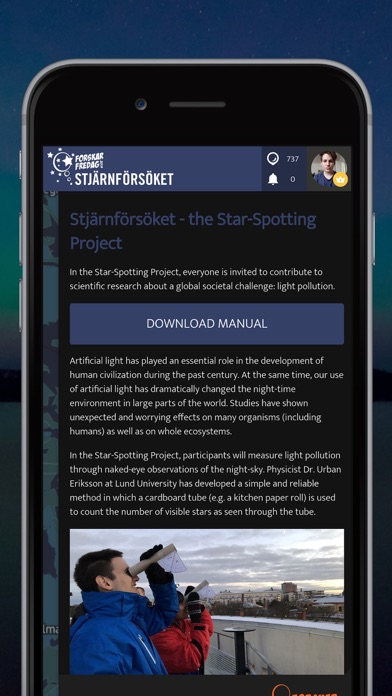
In the Star-Spotting Project, everyone is invited to contribute to scientific research about a global societal challenge: light pollution. Artificial light has played an essential role in the development of human civilization during the past century. At the same time, our use of artificial light has dramatically changed the night-time environment in large parts of the world. Studies have shown unexpected and worrying effects on many organisms (including humans) as well as on whole ecosystems. In the Star-Spotting Project, participants will measure light pollution through naked-eye observations of the night-sky. Physicist Dr. Urban Eriksson at Lund University has developed a simple and reliable method in which a cardboard tube (e.g. a kitchen paper roll) is used to count the number of visible stars as seen through the tube. The Star-Spotting Project will generate a unique map of the distribution and variation of light pollution. It will also generate important knowledge on how this simple method can be used to advance science. By taking part in the project, participants will learn about scientific methods, astronomy, sustainability and urban planning. The project is a collaboration between the non-profit organisation Public & Science (VA), the National Resource Center for Physics Education (NRCF), Lund University, Kristianstad University, the Swedish National Space Agency, and the two science centres House of Science (Vetenskapens hus) in Stockholm and Umevatoriet in Umeå. The Star-Spotting project is running on the SPOTTERON Citizen Science platform for science apps.
Latest release
What’s New
* Mention other users in comments by writing @Username. The person mentioned receives a notification in the news feed. * Make text stand out by writing ** something ** in bold or * something * in italics. * New Data Visualization Interface: heat map view & dot map view of the data. * New button for easier spot updates. * Detection of existing metadata (time and place) in photos when uploading them from your photo album for use in the spot. * Bug fixes and improvements.
Audience growth
Ratings growth
Baseline captured. Growth appears after the crawler observes a changed rating count.
Momentum comes from crawler snapshots for the tracked storefront. “Viral growth signal” means unusually fast recent rating gains; it is an indicator, not download data.
Price tracking
Price intelligence
First snapshot captured. The trend line starts after the next crawler price observation.
- First observed Aug 20, 2026 · 7:23 PM Free
Screenshots