About this app
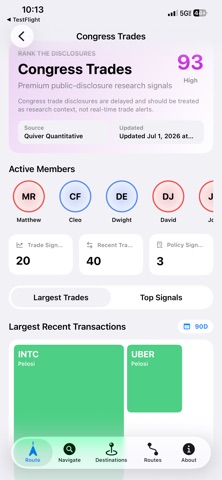
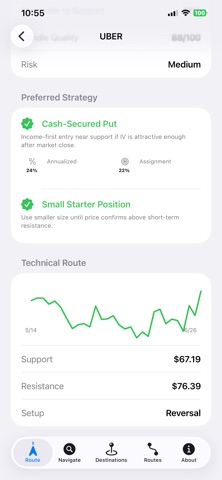
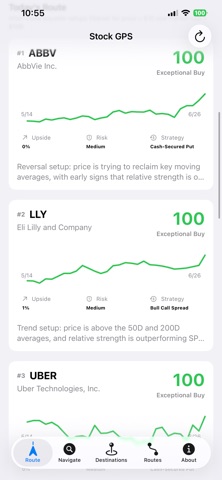
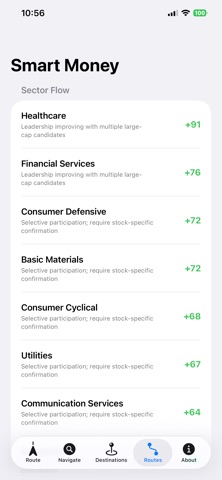
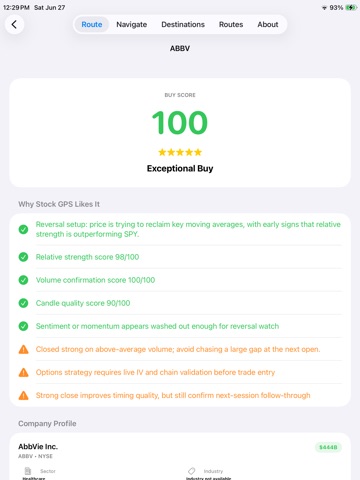
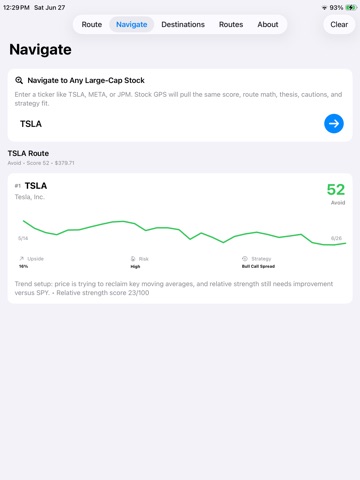
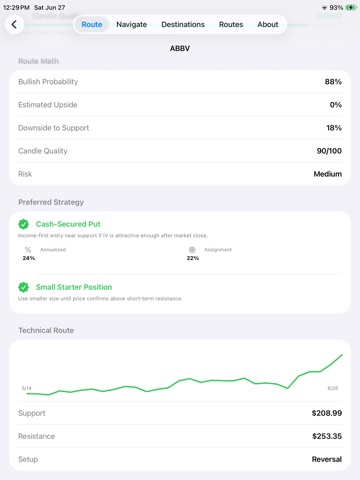
Stock GPS helps you navigate the U.S. stock market with a simple, AI-assisted daily route. Smart Money sector flow tracking to show where money appears to be moving in or out. Sector risk warnings to help identify early pullback or distribution risk. After market close, Stock GPS scans large-cap public companies and highlights potential opportunities using trend signals, reversal setups, relative strength, volume, sector flow, and risk/reward analysis. Instead of forcing you to interpret dozens of indicators, Stock GPS gives each stock a clear score, plain-English reasoning, company profile, technical route, and risk notes. Key features: • Daily Top 10 stock opportunities • AI Stock Score for quick comparison • Buy, Watch, Neutral, or Avoid ratings • Trend and reversal analysis • Company profiles and market cap context • Technical support and resistance levels • Smart-money proxy signals using volume, relative strength, and sector flow • Search any supported ticker for detailed analysis • Clear upside, downside, and risk/reward summaries Stock GPS is designed for research and education, not hype. It helps investors quickly discover stocks worth further review before the next market open. Important: Stock GPS does not provide financial advice. Stock rankings, scores, and analysis are informational and educational only. Always do your own research and consider your financial situation before making investment decisions. Terms of Use (EULA): https://www.apple.com/legal/internet-services/itunes/dev/stdeula/
Latest release
What’s New
Improved GPS Timing with smarter possible top and early-bottom alerts. Bottom signals now factor in volume behavior to better avoid chasing extended rebounds.
Audience growth
Ratings growth
Baseline captured. Growth appears after the crawler observes a changed rating count.
Momentum comes from crawler snapshots for the tracked storefront. “Viral growth signal” means unusually fast recent rating gains; it is an indicator, not download data.
Price tracking
Price intelligence
First snapshot captured. The trend line starts after the next crawler price observation.
- First observed Sep 4, 2026 · 1:58 AM Free
Screenshots