About this app
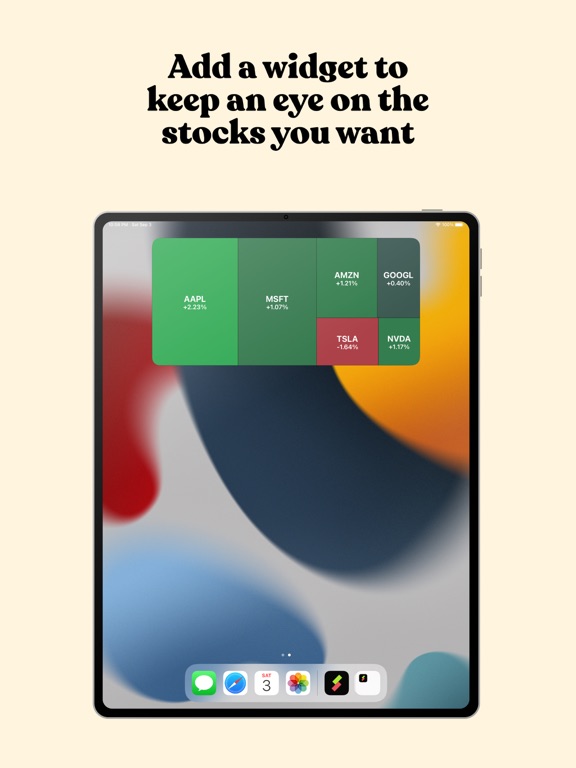
Look at the US stock market at a glance with Stock Map to understand the intraday trends. Stock Map visualizes all the S&P 500, Nasdaq 100, and Dow Jones stocks in a single view with a heat map/treemap and you can see the companies, sectors, and industries with a single look. Main page displays S&P 500 stocks by default. But that view can be changed to display Nasdaq 100 or Dow Jones stocks by tapping on the title at the top. In the main view, tapping on a sector or an industry opens up a detailed view of that company. That way you can see the stocks that might be too small to see easily. When reached to the inner category, tapping on a stock opens the details of this stock in the iOS Stocks app (or in other apps/websites like Yahoo Finance when the user updates the settings). On the Favorites tab, you can add all of your favorite stocks to this view, and only they will appear in this list, so you can keep an eye on the stocks that you are interested in easily. In addition to the main app, you can add widgets to your home page and keep an eye on the stocks. There are two main widget types, you can either add your favorites or you can add an industry category. To be able to do that, long press on the home page and press the "+" button on the top left corner. In the list that appears, search for Stock Map and add the widget type you would like to add. By default, the widget will be updated every 30 mins to not drain your battery quickly. But update frequency can be adjusted in the Widget settings page inside the app. It can be as low as 10 minutes or as high as 1 hour. Stock Map visualizes the stock market with a market heat map (a.k.a. market treemap). The size of a block is determined by the market cap of that company. And the whole map is sorted by the market cap in descending order. Privacy policy: https://stockmap.app/privacy-policy/ Terms and conditions: https://stockmap.app/terms-and-conditions/ Contact: https://stockmap.app/contact/
Latest release
What’s New
- Bug fixes and performance improvements.
Audience growth
Ratings growth
Baseline captured. Growth appears after the crawler observes a changed rating count.
Momentum comes from crawler snapshots for the tracked storefront. “Viral growth signal” means unusually fast recent rating gains; it is an indicator, not download data.
Price tracking
Price intelligence
First snapshot captured. The trend line starts after the next crawler price observation.
- First observed Sep 1, 2026 · 3:51 AM Free
Screenshots