About this app
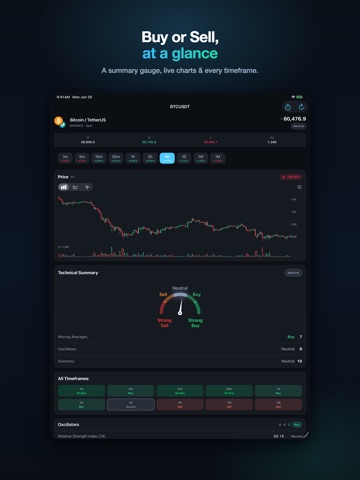
TA Gauge turns the market's technical indicators into a clear Buy / Sell / Neutral read for any crypto, stock, or forex symbol, across 10 timeframes. - SUMMARY GAUGE: an at-a-glance dial that sums up oscillators and moving averages into Strong Sell to Strong Buy. - LIVE CHARTS: candlestick, line, and area charts with moving-average and Bollinger overlays, a crosshair, and volume. - EVERY TIMEFRAME: see the rating from 1-minute to 1-month, and the percent change for each. - OSCILLATORS & MOVING AVERAGES: the full breakdown (RSI, Stochastic, CCI, ADX, MACD, EMAs/SMAs) with each indicator's signal. - WATCHLIST: track symbols with live ratings, sparklines, and % change; sort and group by category. - PORTFOLIO: log holdings (multiple lots, notes, buy dates) and watch live value and profit/loss; hide balances or lock with Face ID. Data and ratings are sourced from public market feeds. TA Gauge is for information and education only and is not financial advice.
Audience growth
Ratings growth
Baseline captured. Growth appears after the crawler observes a changed rating count.
Momentum comes from crawler snapshots for the tracked storefront. “Viral growth signal” means unusually fast recent rating gains; it is an indicator, not download data.
Price tracking
Price intelligence
First snapshot captured. The trend line starts after the next crawler price observation.
- First observed Aug 20, 2026 · 6:54 PM Free
Screenshots