About this app
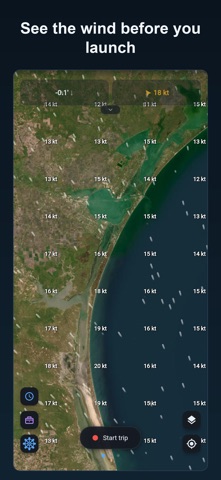
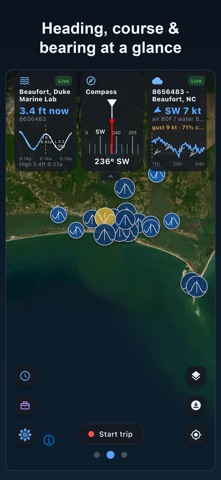
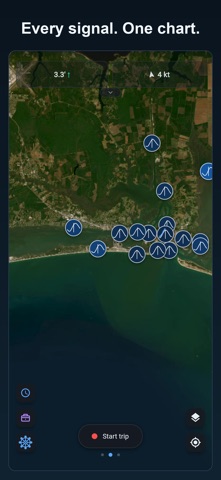
TidalMap puts live tides, marine weather, and forecast overlays on a single interactive chart, so you can read the water before you're on it. Built for the coastal captain, the inshore angler, and the tailwater trout fisherman alike, it pulls the best available data for the exact spot you're looking at and always shows you where it came from and how fresh it is. LIVE & PREDICTED TIDES Predicted and observed water levels from official government tide stations covering the entire US coast, plus Puerto Rico, the USVI, and the Pacific islands. Live gauge pins, interactive tide charts, and a monthly tide calendar. WEATHER & WIND High-resolution wind, precipitation, and cloud forecast overlays across the continental US, plus live offshore buoy observations: wind speed and direction, air and water temps, wave height, and pressure. Animated so you can read the trend, not just a number. FORECAST TIME TRAVEL Scrub forward up to 72 hours with time-travel controls to plan around the wind, the swell, and the rain. SEA-SURFACE TEMP & WATER COLOR Satellite SST, isotherms, and chlorophyll overlays for finding the edges and breaks offshore fishermen chase. CURRENTS & SWELL Surface current and swell forecasts, so you know how the water's moving and what the ride out will feel like. RIVER FLOW & DAM RELEASES Live streamflow gauges with historic-percentile context, plus next-day dam generation schedules. Tailwater anglers are first-class users, not an afterthought. CHARTS & HAZARDS Official raster nautical charts, seamarks, satellite imagery, and bathymetry depth contours with adjustable opacity. Coastal reference notes for the area you're viewing, plus local notices to mariners covering all US coastal districts. SOLUNAR & MOON Major and minor feeding windows, moon phase, illumination, and tidal coefficient, with a solunar force chart overlaid right on the tide calendar. WAYPOINTS & TRIPS Long-press to save a spot with an auto-captured conditions snapshot. Record GPS tracks of your trips, tag conditions for time-travel planning, and sync everything across web and iPhone. OFFLINE CHARTS Download regions before you lose signal, so the chart and your waypoints are there when the bars aren't. COUNTRY-WIDE COVERAGE East Coast, Gulf, West Coast, Puerto Rico, the deep Atlantic, Hawaii, and Alaska, and coverage grows as each upstream source does. BEST-AVAILABLE DATA Every overlay shows the most accurate signal for your spot. Accuracy first, then proximity, then freshness, with the source and age always visible. WHO IS TIDALMAP FOR? Inshore and offshore fishermen. Coastal captains and sailors. Surfers and paddlers checking swell and wind together. Kayakers planning around the current. Tailwater trout anglers watching dam releases. Crabbers, clammers, and beachcombers working the low tide. If your day depends on the water, TidalMap was built for you. FREE 7-DAY TRIAL Try everything free for 7 days. Then TidalMap Premium is $12.99/month or $99.99/year (save 36%). Subscriptions auto-renew until canceled in your App Store settings at least 24 hours before the period ends. QUESTIONS OR IDEAS? We're captains too. Tell us what would make your time on the water better: support@tidalmap.com NOT FOR NAVIGATIONAL USE. Tidal Map is for informational and recreational purposes only. The captain is always responsible for safe navigation. All data is sourced from official US government ocean, weather, and hydrology agencies. Terms of Use (EULA): https://tidalmap.com/terms Privacy Policy: https://tidalmap.com/privacy
Latest release
What’s New
Promo and offer codes are now front and center: a Have a promo code button sits right above the plans, opening Apple's redemption sheet. Signing in on a new device or after switching accounts now reconnects your subscription automatically. No more Restore Purchases tap, and no more flash of the wrong screen while your account loads. Small fixes and polish throughout.
Audience growth
Ratings growth
Momentum comes from crawler snapshots for the tracked storefront. “Viral growth signal” means unusually fast recent rating gains; it is an indicator, not download data.
Price tracking
Price intelligence
First snapshot captured. The trend line starts after the next crawler price observation.
- First observed Aug 23, 2026 · 6:55 AM Free
Screenshots