About this app
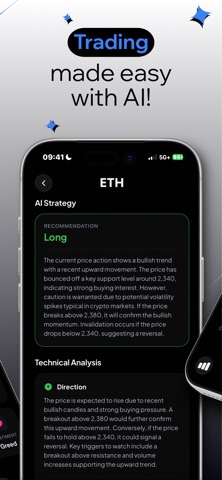
Turn your iPhone into a portable trading expert with just one photo. With the AI-powered TradeLens app, you can transform any chart image into an expert-level analysis in seconds. Simply upload a photo or screenshot and receive an analysis in just a few moments, complete with key signals, metrics, chart patterns, and a clear summary. You can also analyze current market-related news for an asset and ask the built-in Trading Mentor questions about trends, chart formations, risk, strategies, and market movements. No more guessing or emotional trading: TradeLens automatically recognizes patterns and formations so you can make informed decisions, no matter what level you’re at. It’s that simple: 1. Use your phone’s camera or upload a screenshot of a chart 2. TradeLens analyzes the image and identifies key signals, patterns, and market indicators. 3. You receive a clear analysis with technical assessments and relevant information. 4. If you wish, you can also analyze current news about the asset and ask questions in the Mentor Chat. Note: The content provided is for informational and educational purposes only and does not constitute financial or investment advice. Trading financial instruments involves risks. Please always conduct your own research and consult a qualified financial advisor if necessary. A subscription is required to use the app in its entirety. The subscription renews automatically unless canceled at least 24 hours before the end of the current period in your Apple Account settings. Prices may vary by country and are clearly displayed within the app. EULA: https://www.apple.com/legal/internet-services/itunes/dev/stdeula Start trading and profiting today with TradeLens.
Latest release
What’s New
TradeLens just got a fresh upgrade Enjoy a cleaner, more refined design and even a smarter AI analysis to keep you ahead. We’ve also made improvements behind the scenes to give you a smoother, more reliable experience. Loving TradeLens? We’d really appreciate your review
Audience growth
Ratings growth
Baseline captured. Growth appears after the crawler observes a changed rating count.
Momentum comes from crawler snapshots for the tracked storefront. “Viral growth signal” means unusually fast recent rating gains; it is an indicator, not download data.
Price tracking
Price intelligence
First snapshot captured. The trend line starts after the next crawler price observation.
- First observed Aug 1, 2026 · 1:28 PM Free
Screenshots