About this app
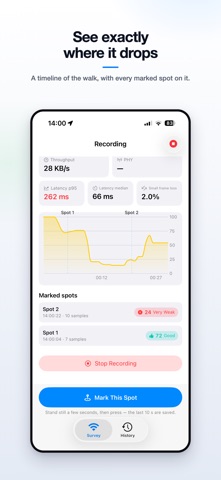
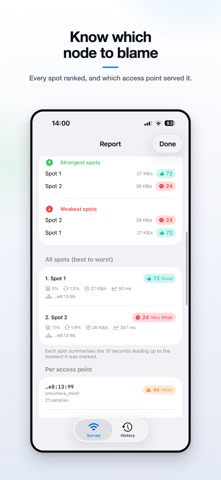
Where should the router go? WiFi Coverage Survey answers that by measuring, not guessing. Start a recording, walk your home, and name the spots you care about — the desk, the couch, the far bedroom. The app measures continuously while you walk and produces a report ranking every spot, so you can see exactly where coverage falls apart and which access point is responsible. WHY NOT JUST A SIGNAL BAR iOS does not give apps the raw signal strength, and even where it is available it is a poor predictor: Wi-Fi hides a weakening link behind retransmission, so everything looks fine right up until the connection collapses. WiFi Coverage Survey instead measures the things that degrade early — loss on large frames, TCP retransmission and failed connections, tail latency, throughput, and the negotiated PHY mode — and combines them into a single 0–100 score. WHAT YOU GET • A live score, dial and chart while you walk • Mark This Spot — captures the 10 seconds before you press, so typing a name never pollutes the measurement • A ranked table of every spot, best to worst • Per access point breakdown: which node served which part of the walk, so you know which one to move • Outage and handover detection • A floor plan you sketch yourself, with your marked spots on it and a coverage heatmap over the walls • Placement advice based on the recording • CSV and JSON export • History, so you can compare before and after moving the router INTERNET SPEED TEST A separate tab measures the line itself rather than the Wi-Fi: download and upload over parallel streams, idle latency and latency under load, and which Cloudflare edge is serving you. Runs are kept in a history on the device so you can compare them. Five tests a day. PRIVACY The survey is measured against your own router and stays on your device — nothing is uploaded. The internet speed test is the one exception: it exchanges traffic with our own test server, and only when you start it. Location permission is requested only because iOS will not reveal the Wi-Fi network name to an app without it — your location is never recorded or shared. NOTES Recording needs the screen on, because iOS does not allow Wi-Fi sampling in the background. Measurement is deliberately intensive, so expect noticeable battery use during a walk. The survey's throughput figure is relative to your own router and is not a measure of your internet connection — the speed test tab does that.
Latest release
What’s New
Two big additions in 1.1. INTERNET SPEED TEST A tab of its own that measures the line, not just the Wi-Fi: download and upload over parallel streams, idle latency and latency under load, and which Cloudflare edge is serving you. Every run is kept in a history on the device. Five tests a day. FLOOR PLAN Sketch your walls with a finger, drop the spots you marked onto the sketch, and read the coverage heatmap drawn over the plan. The app now also speaks Turkish, German, Spanish, French and Japanese.
Audience growth
Ratings growth
Baseline captured. Growth appears after the crawler observes a changed rating count.
Momentum comes from crawler snapshots for the tracked storefront. “Viral growth signal” means unusually fast recent rating gains; it is an indicator, not download data.
Price tracking
Price intelligence
First snapshot captured. The trend line starts after the next crawler price observation.
- First observed Sep 11, 2026 · 6:41 AM Free
Screenshots