About this app
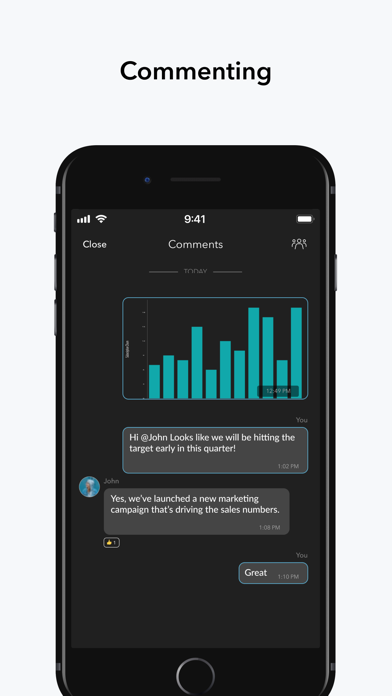
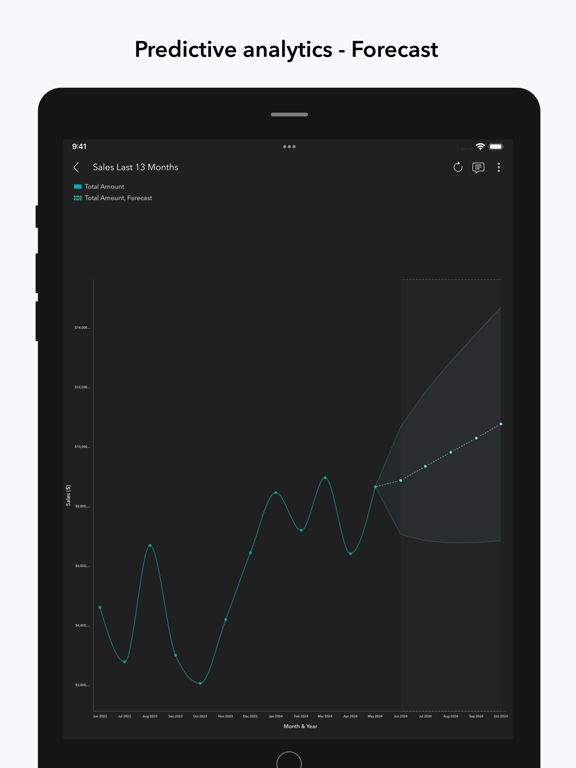
View insightful visualizations on-the-go, enabled by this data visualization software. This mobile business intelligence (BI) app complements the larger web browser-based view offered by Zoho Analytics, the self-service BI and analytics software on the cloud. The mobile BI Analytics app enables you to keep track of your key business metrics, spot trends early, collaborate with your colleagues, and arrive at informed business decisions, all on the go. With this app, you can view all the data, reports and dashboards that you created and have in your Zoho Analytics account. You can interact with the reports, favorite those that you like or view very often, share them with your colleagues, clients and friends with fine-grained access control, and do much more. The app allows you to analyze data and perform business data analytics, from a wide range of sources easily. It scales well and can crunch hundreds of millions of rows of data creating mobile analytics dashboards. The below features make the Zoho Analytics app an indispensable mobile BI analytics and reporting tool, for any business user. Key Features - Wide range of visualization options - geo-map, pie, donut, bar, stacked bar, line, bar-line combo, funnel, heat-map, web and a lot more chart types; Pivot tables, summary and tabular views. - View single page, at-a-glance dashboards. - Dashboards like KPI dashboards, business dashboards, marketing analytics dashboards, sales analytics dashboards, and much more can be created with ease - Apply filters and see filtered data. - See the underlying data, or drill-down any point in the report. - Segregate reports based on type, folders and related views. - Quickly access select reports using Favorites and Recent Items. - Export and share your reports with your colleagues and clients, with fine-grained access control. You control what the shared user can or can't do, like create reports, view/drill-down the underlying data, export the data/reports, etc.
Latest release
What’s New
Visual Insights: The Insights experience has been enhanced with visual insights in addition to the existing textual insights. Diagnostic Insights: Automatically identifies and configures the key factors influencing the target metric for Key Driver Analysis (KDA) using AI-powered analysis and business context. Recommendations: Gain actionable recommendations that help improve performance, address issues, and achieve desired business outcomes.
Audience growth
Ratings growth
Baseline captured. Growth appears after the crawler observes a changed rating count.
Momentum comes from crawler snapshots for the tracked storefront. “Viral growth signal” means unusually fast recent rating gains; it is an indicator, not download data.
Price tracking
Price intelligence
- First observed Sep 20, 2026 · 4:31 AM Free
Screenshots