About this app
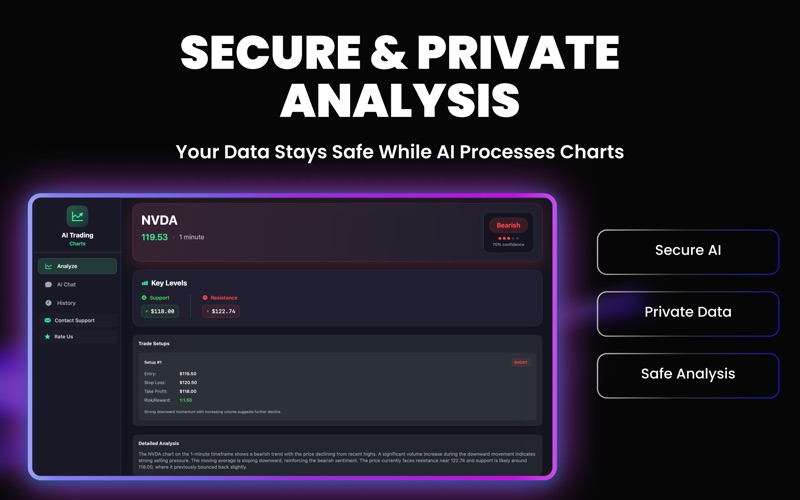
Point AI at any chart and get a structured read back in seconds. Screenshot a chart — crypto, stocks, forex, any platform, any timeframe — drop it in, and the AI reads it back to you: the pattern it sees, the trend, the support and resistance levels, and where the risk sits. Plain language, no jargon wall. No account linking. No API keys. No broker connection. Nothing to set up. WHAT THE READ CONTAINS • Chart patterns identified and named • Trend direction and structure on the timeframe you uploaded • Support and resistance zones marked out • Candlestick behaviour explained in context • The indicators visible on your chart, put in context • Risk and reward framing, so the decision stays yours LEARN TECHNICAL ANALYSIS WHILE YOU USE IT Every read shows the reasoning, not just a verdict. Read why a level matters, or why a pattern is only half formed, and you start seeing it yourself on the next chart. Beginners use it as a tutor. Experienced traders use it as a second opinion before they act. WORKS WITH THE CHARTS YOU ALREADY USE If you can screenshot it, you can analyze it — a mobile app, a desktop terminal, a chart in an article. Nothing to import, nothing to sync. Live prices are in the app, and AI analysis runs on demand, whenever you ask for it. WHAT THIS IS NOT This app analyzes charts and explains technical analysis. It does not place trades, connect to a broker, or give financial advice. No signals, no performance promises. Note: Subscriptions are billed monthly or annually through your Apple ID account at the time of purchase. Payment will be charged to your Apple ID upon confirmation, and your subscription will automatically renew unless auto-renew is turned off at least 24 hours before the end of the current billing period. You can manage or cancel your subscription at any time in your App Store account settings after purchase. Terms & Conditions: https://nexentlabs.figma.site/apps/forex-trading-analyzer/terms Privacy Policy: https://nexentlabs.figma.site/apps/forex-trading-analyzer/privacy
Latest release
What’s New
Live prices are now in the app, so you can check where the market stands while you read a chart. AI analysis on demand — ask for a fresh read of any chart the moment you need one. Bug fixes and stability improvements.
Audience growth
Ratings growth
Baseline captured. Growth appears after the crawler observes a changed rating count.
Momentum comes from crawler snapshots for the tracked storefront. “Viral growth signal” means unusually fast recent rating gains; it is an indicator, not download data.
Price tracking
Price intelligence
First snapshot captured. The trend line starts after the next crawler price observation.
- First observed Aug 1, 2026 · 1:28 PM Free
Screenshots