About this app
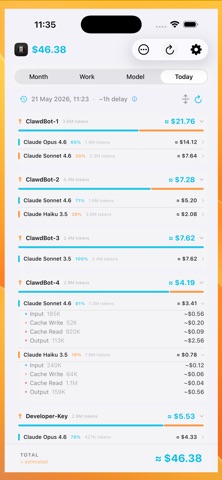
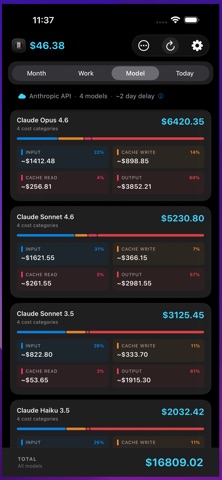
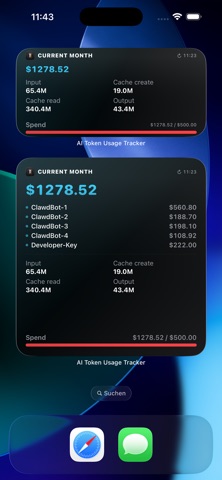
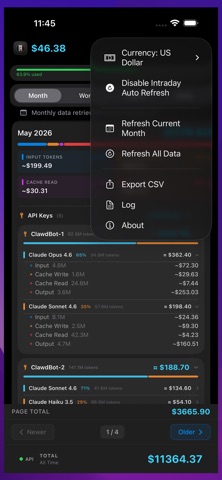
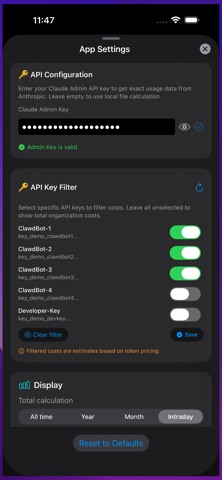
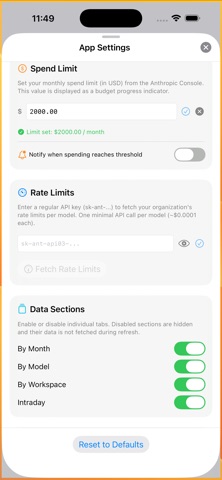
Know exactly what your Claude AI bots cost you. Monitor your Claude token burn rate and see exactly how much your AI workflows spend. Whether you're running Claude Code, OpenClaw, ClawBot, or your own custom AI agent — this tool helps you understand exactly how much your API-based AI workflows cost. Track your Claude API keys, keep an eye on what your bots are spending, and set alerts before costs get out of hand. Redesigned with Liquid Glass for iOS 26. Perfect for developers building with AI agents, coding assistants, or automated workflows. Screenshots are taken from the Light and Dark mode with different backgrounds and Glass Styles. FREE FEATURES • Nearly real-time (~1 hour delay) cost tracking in your menu bar • Monthly cost breakdown with token details (input, output, cache read, cache creation) • Workspace/project cost breakdown • CSV export of your usage data • Multi-currency support (USD, EUR) with live exchange rates • Configurable spend limit with native macOS notifications • Auto-refresh every 30 minutes • Dashboard Widgets PRO FEATURES (ONE-TIME PURCHASE) • Intraday Analysis — see today's spending hour by hour • Model Overview — exact costs per AI model • API Key Breakdown — track costs per individual API key • Unlimited API Keys — monitor multiple accounts at once • 7-day free trial included Your purchase applies also to Mac and Apple Vision Pro — buy once, use on all your devices. PRIVACY FIRST Your API keys are stored securely in the iOS Keychain. No data collection. No analytics. No tracking. All processing happens locally on your iOS device. Built for developers who use Claude Code or the Claude API and want to keep their costs under control. Also available on Apple Vision Pro and macOS. Requires an Anthropic Admin API key. Subscription-based usage (claude.ai, Claude Desktop) is not tracked.
Audience growth
Ratings growth
Baseline captured. Growth appears after the crawler observes a changed rating count.
Momentum comes from crawler snapshots for the tracked storefront. “Viral growth signal” means unusually fast recent rating gains; it is an indicator, not download data.
Price tracking
Price intelligence
First snapshot captured. The trend line starts after the next crawler price observation.
- First observed Aug 1, 2026 · 1:31 PM Free
Screenshots