About this app
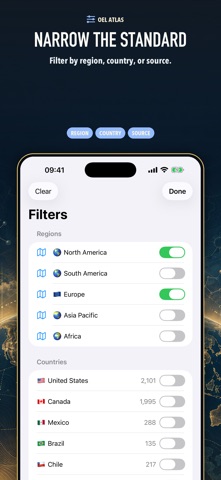
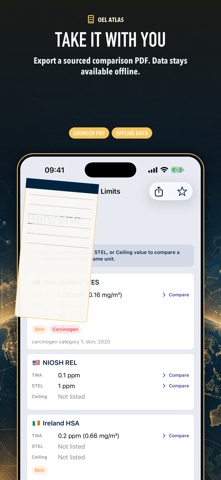
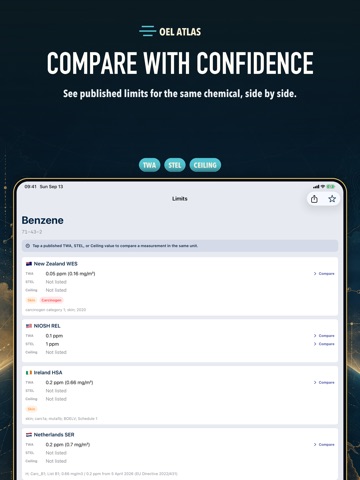
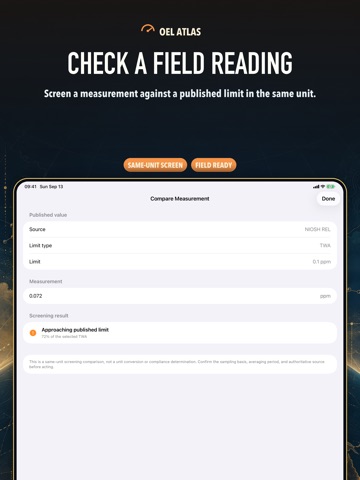
The world's first global Occupational Exposure Limit (OEL) database at your fingertips. OEL Atlas puts data from 30+ regulatory bodies across 22 countries in your pocket. Compare OSHA limits against Germany, Japan, Australia, and 26 other jurisdictions in seconds. Essential for anyone making chemical safety decisions in multinational facilities. A subscription is required to access OEL Atlas. A 30-day free trial is included; after the trial. Military & veteran discount available in-app. WHAT'S INCLUDED WITH SUBSCRIPTION: Chemical Heat Map — see which jurisdiction has the strictest limit for any chemical at a glance World Map: Tap any country → instantly surface that jurisdiction's OEL data Periodic Table Interface: Search elemental compounds and view global limits side-by-side Carcinogen Flagging: Know which chemicals OSHA, ACGIH, or IARC list as carcinogens Export Reports: Generate PDF comparison sheets for your compliance file Offline Mode: No internet? No problem — all data is bundled BUILT BY AN IH PROFESSIONAL Created by a former Navy Industrial Hygiene Officer with 25+ years of field experience. Not a generic safety app — this is built by someone who has actually stood in the trenches enforcing OELs. WHO USES OEL ATLAS: Industrial Hygienists (IH) Occupational Health Consultants Facilities/EHS Managers Safety Directors Environmental Health & Safety Specialists Compliance Officers WHY OEL ATLAS IS DIFFERENT: Other apps show you ONE jurisdiction's rules. OEL Atlas shows you ALL OF THEM. Want to know if a chemical is stricter under German law than OSHA? One tap. Comparing ACGIH recommendations to Singapore standards? Done. This level of breadth doesn't exist anywhere else on iOS. Terms of Use (EULA): https://www.apple.com/legal/internet-services/itunes/dev/stdeula/ Privacy Policy: https://www.fouledanchorsafety.com/privacy/
Latest release
What’s New
Bug fixes and performance improvements for a smoother experience. Enhanced language support for clearer, more consistent translations and easier navigation.
Audience growth
Ratings growth
Baseline captured. Growth appears after the crawler observes a changed rating count.
Momentum comes from crawler snapshots for the tracked storefront. “Viral growth signal” means unusually fast recent rating gains; it is an indicator, not download data.
Price tracking
Price intelligence
First snapshot captured. The trend line starts after the next crawler price observation.
- First observed Sep 30, 2026 · 4:17 AM Free
Screenshots