About this app
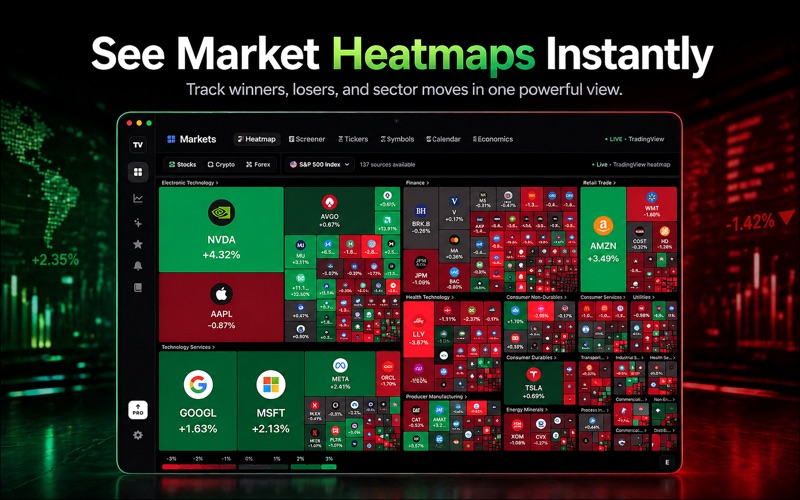
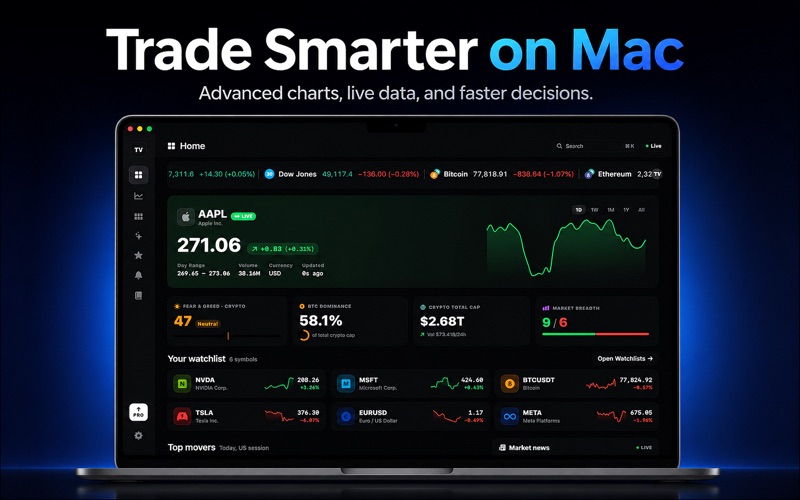
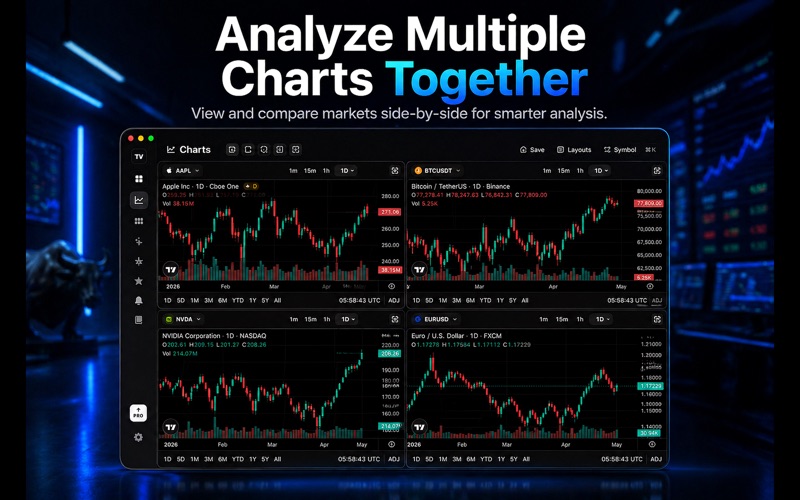
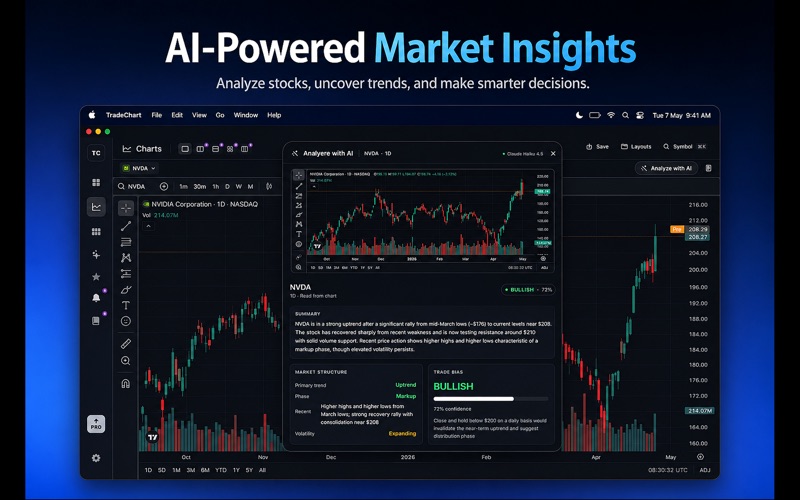
Trading Charts is a native macOS trading studio for traders who want TradingView-grade charts and AI-powered chart analysis on the Mac — without the browser tab clutter. KILLER FEATURES • Multi-chart layouts — 1×1, 1×2, 2×1, 2×2, and 1×3 grids. Watch up to four symbols at once. Each pane has its own symbol, timeframe, and chart type. • Analyze with AI — tap a button on any chart pane and Claude Haiku 4.5 reads the candles directly. You get a structured breakdown: primary trend, market phase, support and resistance zones, indicator state, and a directional bias with honest confidence. Three-second answers on Apple Silicon. • Universal symbol search — any stock, ETF, crypto pair, forex pair, future, or index. Curated favorites instantly, with the long tail backed by live search. ⌘K from anywhere. • AI Studio — pick a symbol or upload a chart screenshot. Generate Idea, Explain Indicator, Forecast Price (Pro). Drag-and-drop image input or pick from Finder. • Saved analyses — every chart you analyze is saved automatically with the captured screenshot. Re-open any past breakdown anytime. • Native Mac feel — icon sidebar, ⌘K palette, full keyboard shortcuts, multi-window, menu bar popover with live indices. Apple Silicon native. • Live data — Yahoo Finance for prices and sparklines, TradingView embed widgets for charts, real-time crypto sentiment, market news feed. PRO Free users get one AI analysis lifetime. Pro unlocks unlimited AI use, every multi-chart layout, multiple watchlists with drag-reorder, native price and indicator alerts, the AI trade journal with weekly review, and priority support. • Weekly — $5.99/wk • Monthly — $14.99/mo (3-day free trial) • Yearly — $49.99/yr (3-day free trial) • Lifetime — $99.99 (one-time, was $199.99 — 50% off) PRIVACY-FIRST We don't have user accounts. We don't have your email. The only identifier we hold is the anonymous RevenueCat user ID that maps your subscription receipt to your install. AI screenshots flow to Anthropic for processing and are never stored on our servers. DISCLAIMER Trading Charts is a market-data viewer. It does not connect to brokerages, place trades, or move money. AI-generated analysis is educational and not financial advice. Past performance is not indicative of future results. Privacy: https://web-seven-green-74.vercel.app/privacy Terms: https://web-seven-green-74.vercel.app/terms
Latest release
What’s New
Improved App Store discoverability — easier to find Trading Charts when you search for what you actually need: TradingView-grade charts, multi-pane layouts, and Claude-powered AI analysis. Same app, same Pro plans, same privacy posture.
Audience growth
Ratings growth
Baseline captured. Growth appears after the crawler observes a changed rating count.
Momentum comes from crawler snapshots for the tracked storefront. “Viral growth signal” means unusually fast recent rating gains; it is an indicator, not download data.
Price tracking
Price intelligence
First snapshot captured. The trend line starts after the next crawler price observation.
- First observed Aug 8, 2026 · 10:38 PM Free
Screenshots