About this app
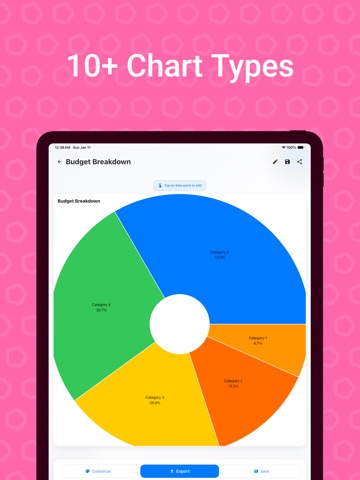
Transform your data into professional charts in seconds! Chart Maker is the ultimate data visualization tool, now supercharged with cutting-edge AI technology. Whether you're a student, researcher, or business professional, you can visualize complex data beautifully without any learning curve. REVOLUTIONARY AI IMAGE-TO-CHART Forget manual data entry! Simply take a photo of any printed chart—from textbooks or reports—and our AI will instantly convert it into a fully editable digital graph. 10+ PROFESSIONAL CHART TYPES Bar & Stacked Bar Charts: Compare categories effortlessly. Line & Area Charts: Visualize trends and cumulative totals. Pie & Doughnut Charts: Show proportions at a glance. Advanced Plots: Scatter, Radar, Polar Area, and Bubble charts. KEY FEATURES Intuitive Editor: Simple drag-and-drop interface. Customization: Full control over colors, fonts, and styles. High-Res Export: Ready for presentations or social media. Works Offline: Create and edit anywhere, anytime. PREMIUM ADVANTAGE Unlock the AI Image-to-Chart feature, unlimited exports, and an ad-free experience. Terms of Use: https://www.apple.com/legal/internet-services/itunes/dev/stdeula/
Audience growth
Ratings growth
Baseline captured. Growth appears after the crawler observes a changed rating count.
Momentum comes from crawler snapshots for the tracked storefront. “Viral growth signal” means unusually fast recent rating gains; it is an indicator, not download data.
Price tracking
Price intelligence
First snapshot captured. The trend line starts after the next crawler price observation.
- First observed Aug 16, 2026 · 1:15 AM Free
Screenshots